Winning the Fantasy Game
The US Open introduced an extra way to engage with the event this year with a Fantasy Tennis competition. In this post, I share a simulation model that can help with fantasy strategizing. The basic idea is to run outcomes of the US Open men’s and women’s draws, predict match statistics for each hypothetical match, and tabulate the corresponding fantasy points that are up for grabs with each match. This model alone won’t win you the fantasy game, where so much luck is involved, but it can be a useful tool for choosing more winnable strategies.
If you didn’t attempt the IBM-sponsored Fantasy Tennis for this year’s US Open, here are the basic rules. Competitors build a roster of one player from each quarter of the men’s and women’s draws. Only one player in the top 16 seed is available. In each round, players earn 100 points for a match win, 5 points for each break of serve and 2 points for each ace. There was some allowance for a reshuffling of the roster after the 4th round, but I don’t know exactly how that worked so I will just focus on the outcome of the initial rosters.
So the main question is how to pick a good roster? Well, you have to start by defining what you mean by good. I think a reasonable starting point for a ‘good’ strategy is to maximize some measure of roster point distributions. This means that a crucial first step is estimating the fantasy point distribution for each player in the draw.
The easiest way to think about how to do this is to focus on one match. Given a specific player and opponent, we want to predict the winner and the breaks and aces earned by each player. There are myriad ways to predict match outcomes in tennis and I went with Elo ratings. For the match statistics, we need to know the likely duration of the match to have a better idea of the total count of any in-match statistic. Total service games seemed a natural choice to me since both breaks and aces can only be earned on return or service games, not both. If we can estimate the likely service games, all that remains is to predict the probable breaks and aces with each service game played.
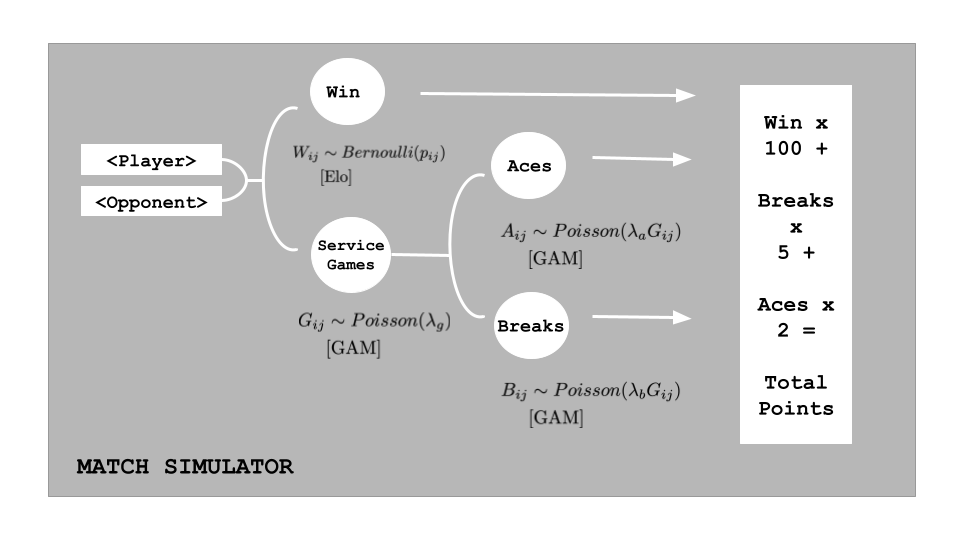
The diagram above summarizes all of the components and the basic modeling technique. I built Poisson GBM models for each of the match statistics using the following features:
- Surface category
- QF or better indicator
- ‘Best of’ indicator (for men only)
- Elo rating total (player + opponent)
- Elo rating difference (player + opponent)
- Serve win percent total (player + opponent)
- Serve win percent difference (player + opponent)
All together, these factors get at the major match conditions that can influence match statistics, as well as the overall quality and competitiveness of the match based on the player’s overall talent and serve performance. Here, the serve win percent are the observed performance but rather the expected serve performance for the given player and year, based on a linear mixed model. The purpose of this is to control for the different matches played and opponents faced by each player, which can add noise to their actual serve results.
The advantage of the GBM here is to capture possible interactions or non-linearities that may be present about these features. Although, to be honest, the GBM doesn’t do much better than a simple log-linear model. But it is a more flexible approach to build on.
With all of these components in place, setting up a Monte Carlo simulation should hopefully be easy to see. We start with the first round matches, draw an Elo-based winner for each match, predict the games, breaks and aces for each player with the GBM-based event rates for a hardcourt slam match and the two players facing off. Assign the fantasy points according to the game rules and go through the same process for the next round. I repeated the whole process 10,000 times for the men’s and women’s draws to get the fantasy point distribution for every player.
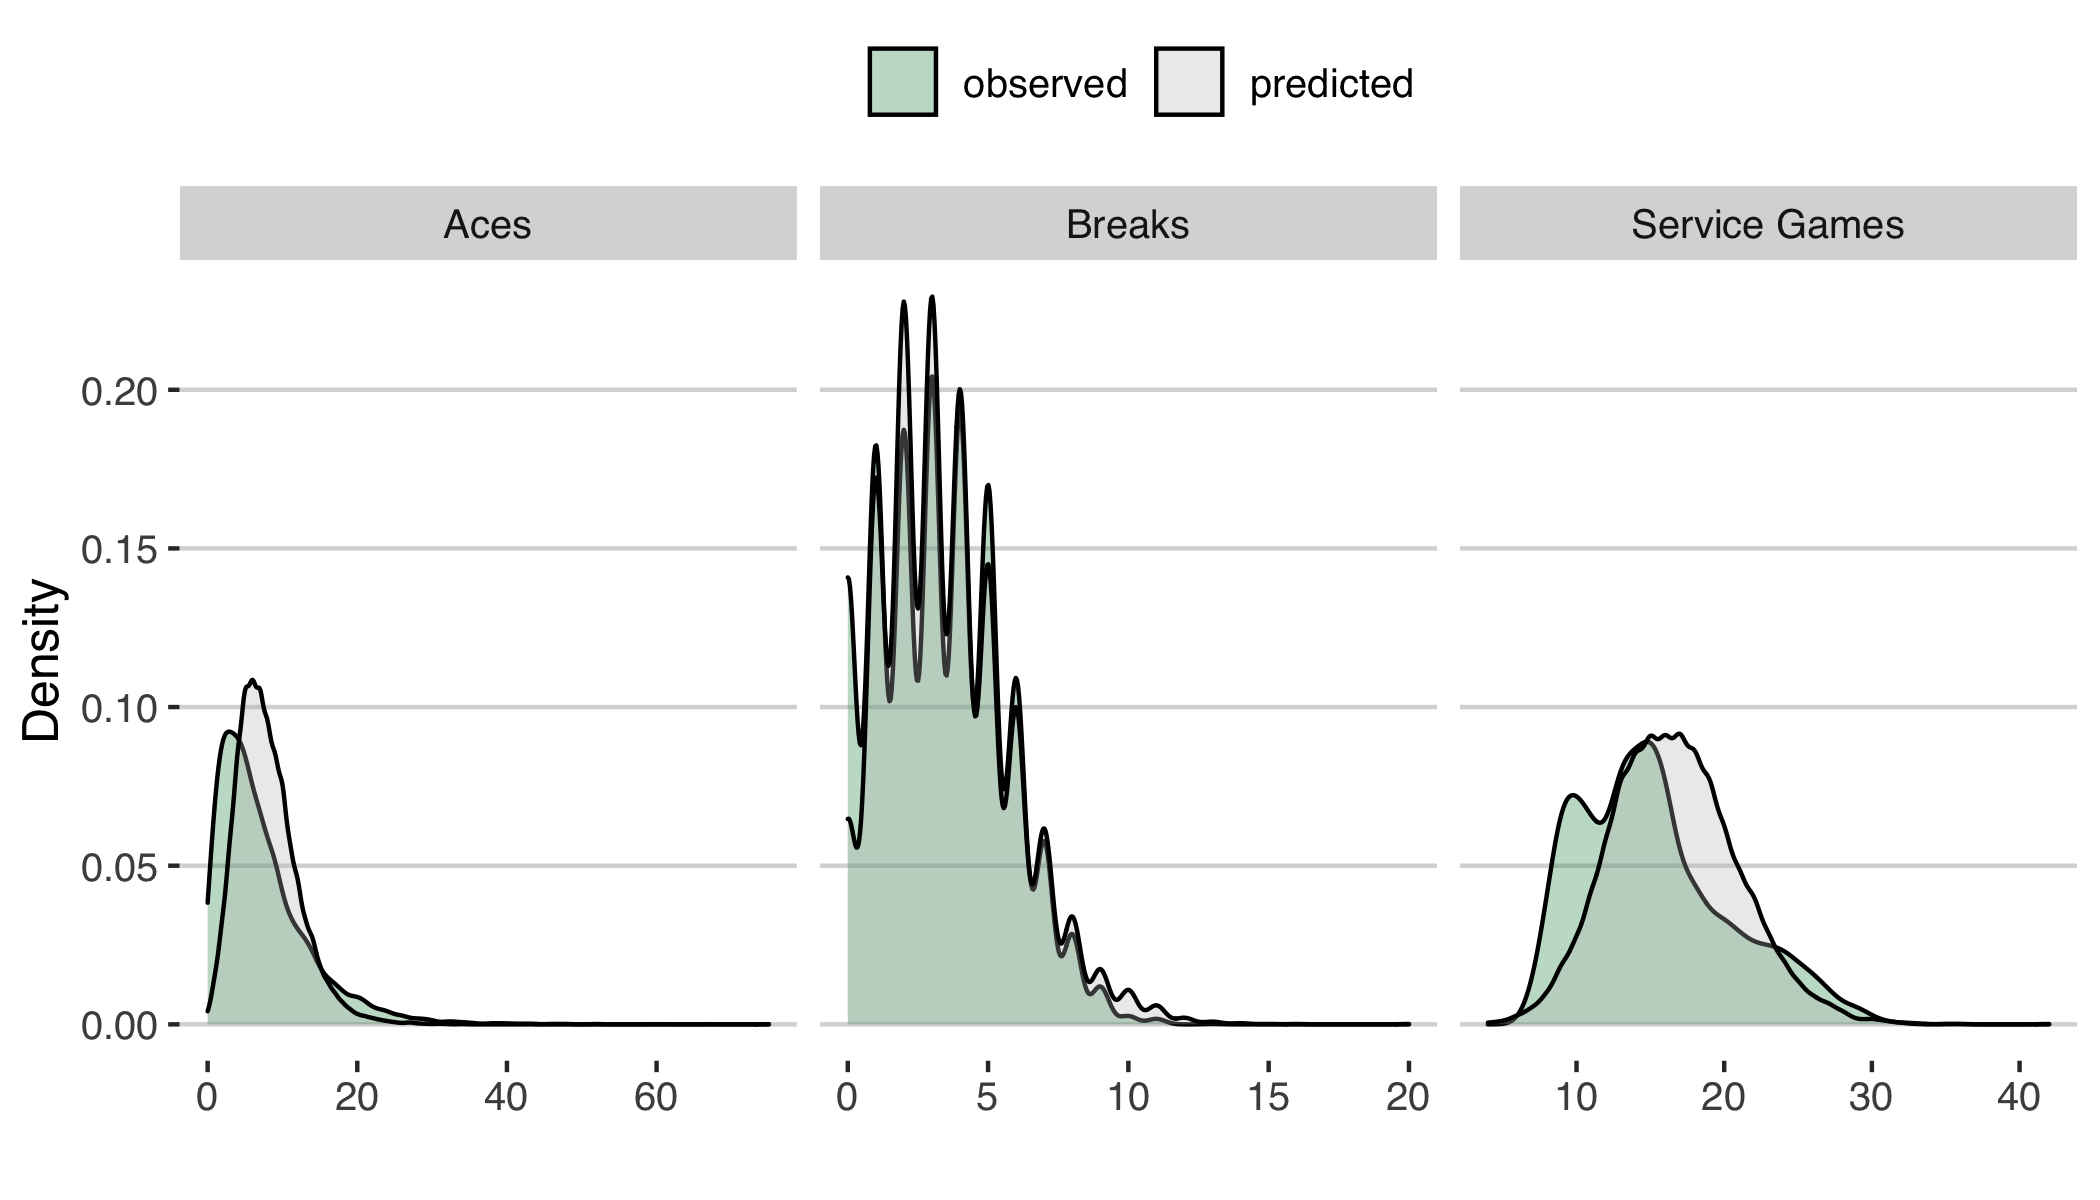
How useful this exercise is will depend in large part to the quality of the predictions. The Elo model is well-known to be a solid approach for tennis match predictions with 70%+ accuracy at Grand Slams. For the match statistics, the distributions below give a comparison against the hardcourt majors over the past decade. We can see that we are capturing a lot of the major properties of each statistics. There is some suggestion of over-estimating aces and service games for men (Figure 2).
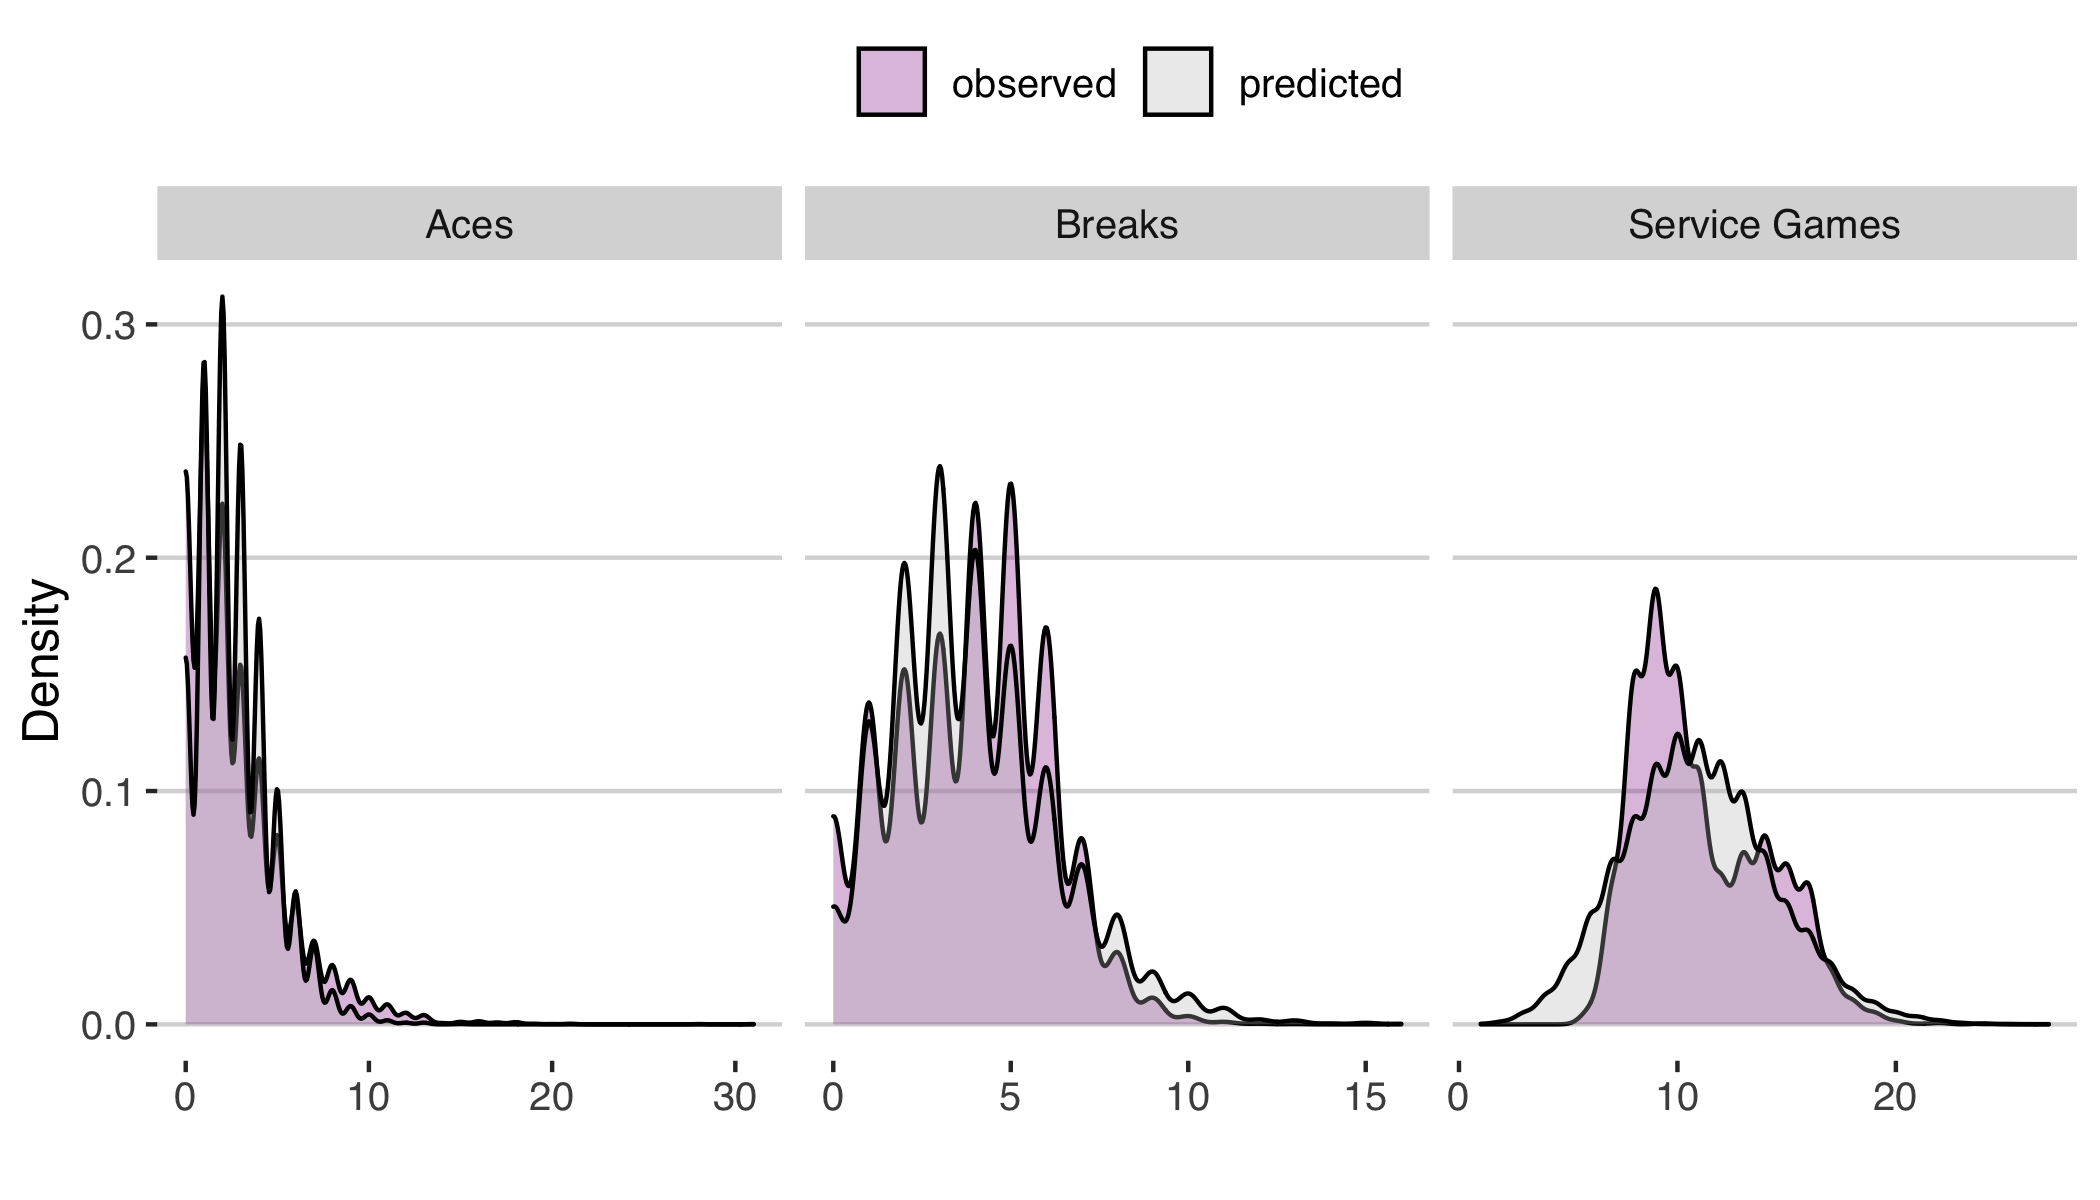
On the women’s side, the predicted distributions for each match statistic is generally good (Figure 3). There is a bimodality in the service games for the WTA that isn’t predicted by the model, but the mean and variance of the distribution is still in good agreement. So, definitely some room for improvement, but a good starting point for deriving the fantasy point distribution.
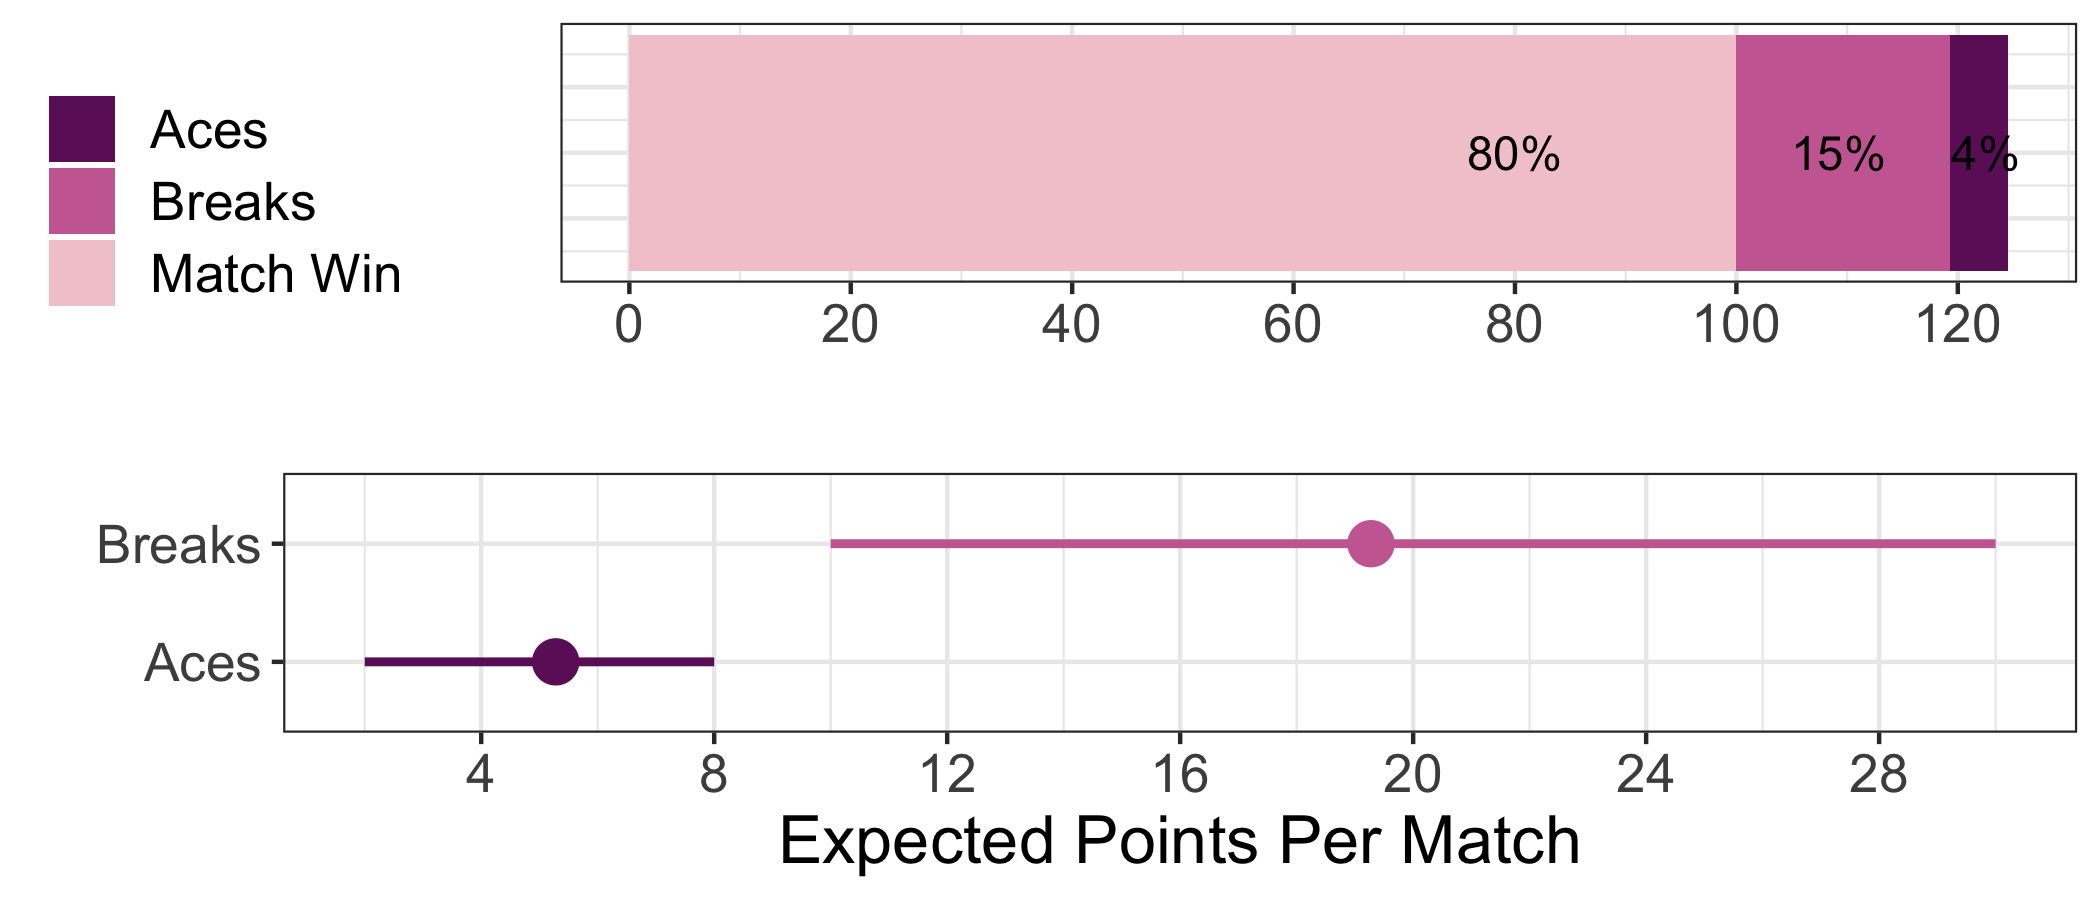
When I first read the rules of the fantasy game, one of the questions I had was how much to weight aces and breaks of service relative to match wins. With 100 points per win, it seemed clear that winning would make up the majority of points, but how big a majority? I wasn’t sure. Here is one of the ways our simulator can lend a hand.
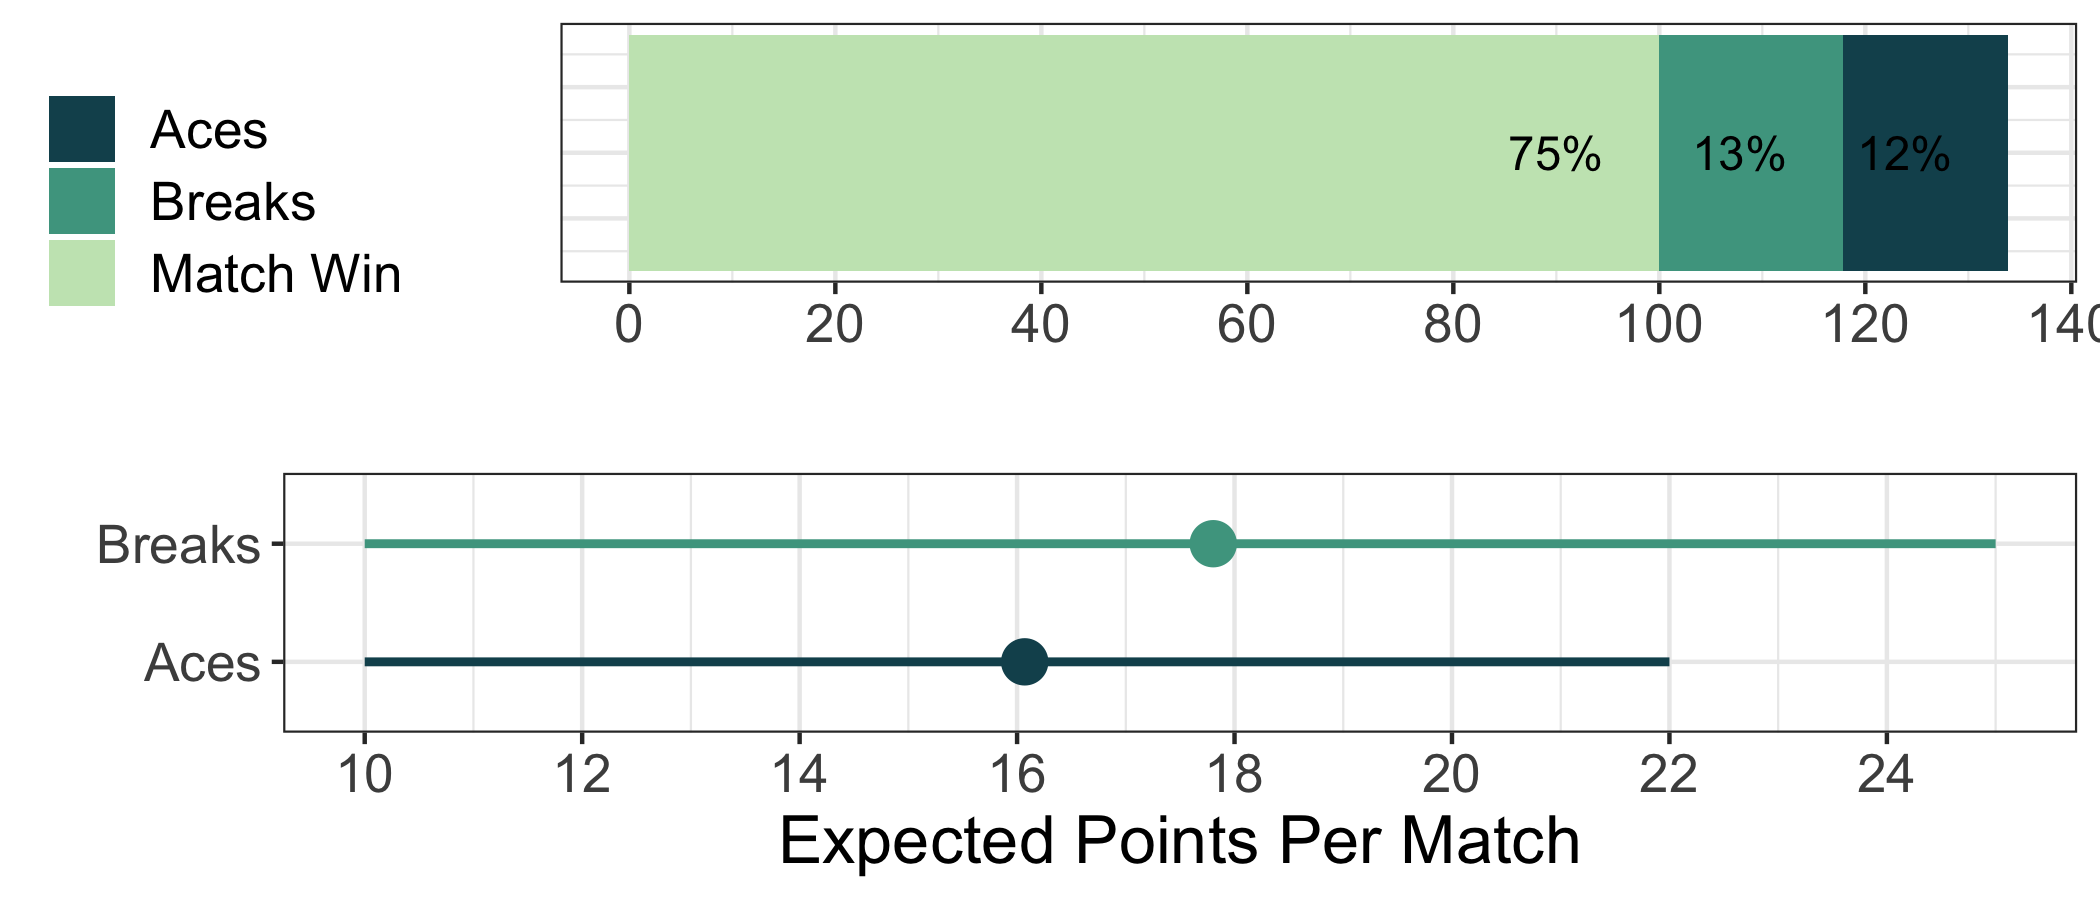
Based on all the matches in our event simulations, the mean points among match winners show that the points for winning make up 75% of the total fantasy points in men’s matches. Interestingly, the aces and breaks have a roughly equal share of the remaining points. This tells us that the points for breaks and aces are approximately equal to the standard deviation of the other stat. The plot on the bottom row shows the lower and upper 10th percentile of points for each match stat and we see a range of +/- 6 points for aces and +/- 8 points for breaks.
On the women’s side, match wins make up an even higher percentage of the total points. This is due to the lower frequency of aces in the women’s game. In fact, aces account for a meagre 4% of the fantasy points in a typical women’s match.
What does our simulator suggest about the point distribution for players at the start of the event? On the men’s side, the four semifinalists end up at the top in terms of expected fantasy points, with Zverev, Medvedev and Djokovic all expected to earn over 500 points on average. It is also notable that the majority of the top 32 are seeded players, but not all. Players like Frances Tiafoe and Ilya Ivashka were two examples of ATP players who were expected to out-perform their ranking.
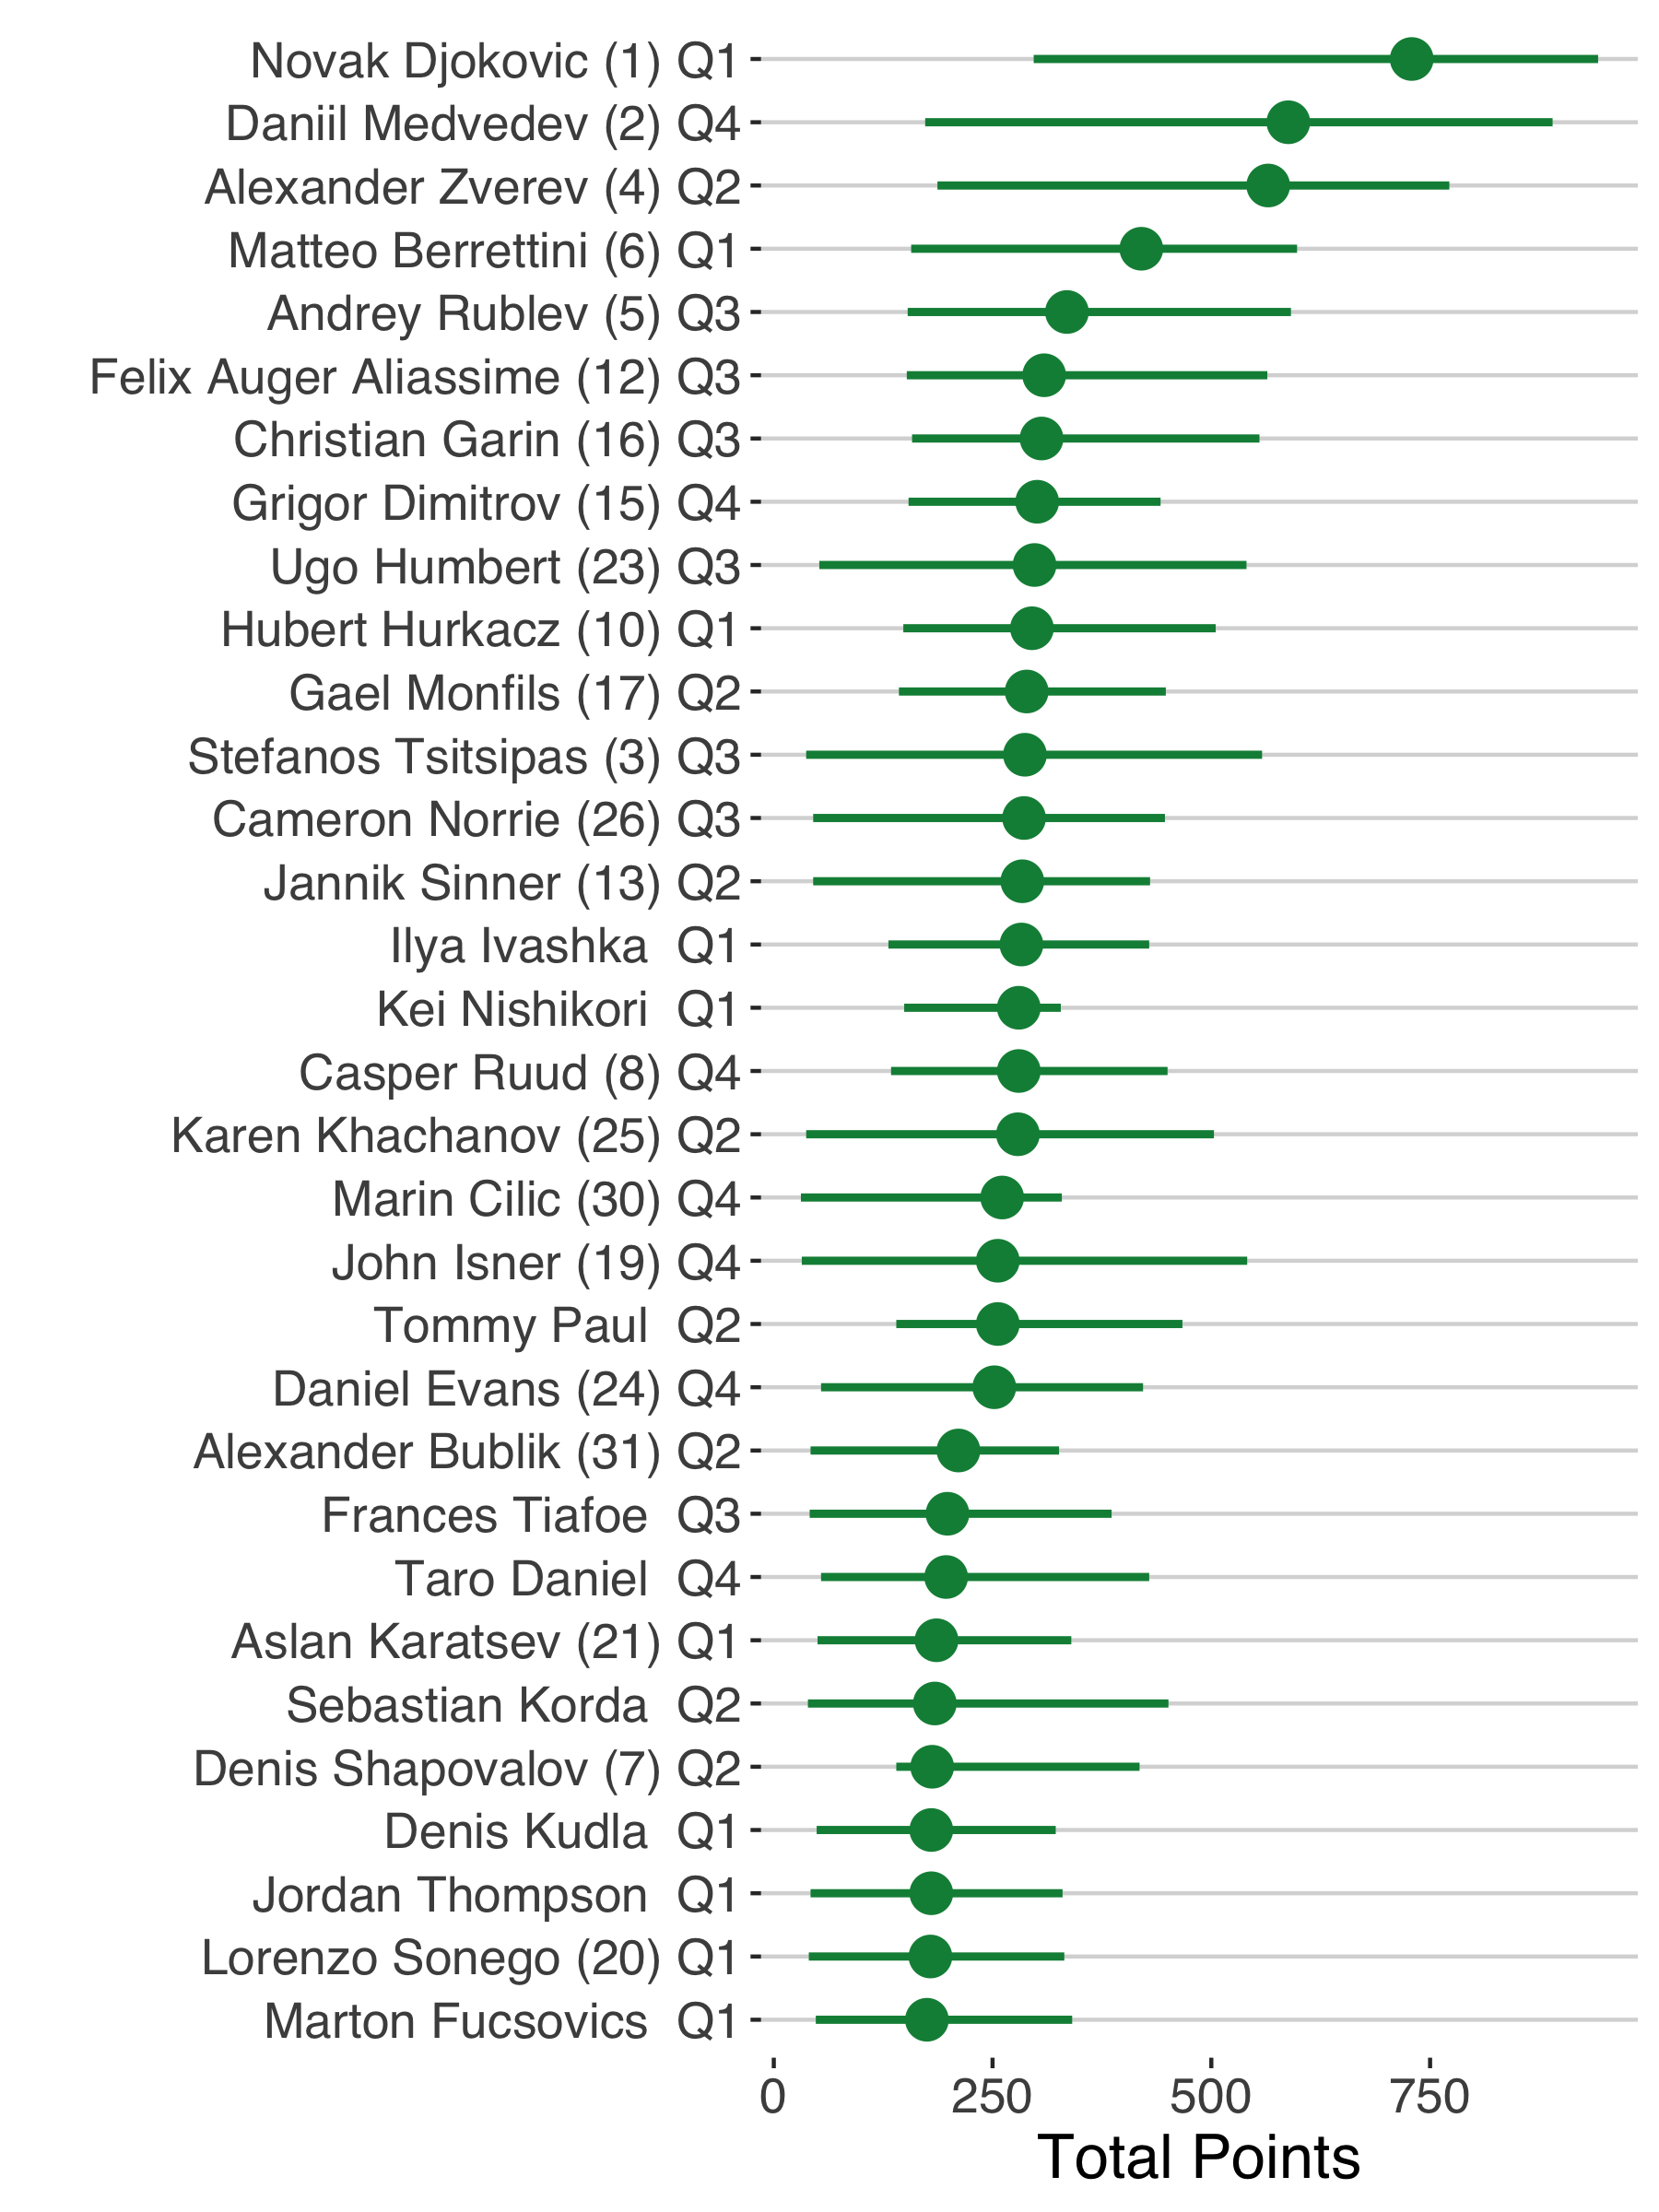
Considering the representation by quarter, we find that Q1 and Q3 were the most stacked with point potential. Indeed, among the ten players with the highest expected points, only 1 was from Q2 and only 2 were from Q4.
Examining the lower 10th and upper 10th point intervals in the player point distributions is also revealing (Figure 6). For instance, all but the top players have a lower interval that is less than 100 points, which tells us that that scenario driving the lower tail of the distribution is the scenario where those players lose in the first round. On the other hand, few players have an upper range beyond the 500 points range, indicating that the best-case scenario for the large majority of players is no better than a quarterfinal win. It is at these extremes of the point distribution where we see more extreme draw effects.
While the player point breakdowns are interesting, the ultimate decision with the fantasy competition is the roster construction. Suppose we have a point criteria for each player. One way to find the optimal roster is to start by selecting the top 16 player from each quarter that maximizes the criteria and do the same for the outsider-16 players in each remaining quarter. This would result in 4 possible rosters which we could then compare on the combined points.
But what is the point criteria we should use? Well, this comes down to the risk we are willing to take. One approach is the “in expectation” strategy, where we go with the maximal points assuming players play to their average. Another option is the worst-case or minimax strategy where we assume players play to their worse and we maximize the points in the worst-case scenario. The flipside of the worst-case scenario is the best-case scenario. Below we consider all three options and the rosters that would be suggested with each.
When it comes to the top seed choice for Q1, Q2 and Q4; we would opt for the same player under any of the risk strategies (Figure 7). For Q3, there is a difference in the top seed choice if we want to minimize our loss under the worst-case scenario. This is because Christian Garin was predicted to earn more points in a first round loss than Andrey Rublev, so those two were close enough in this case that the impact of draw becomes more important here.
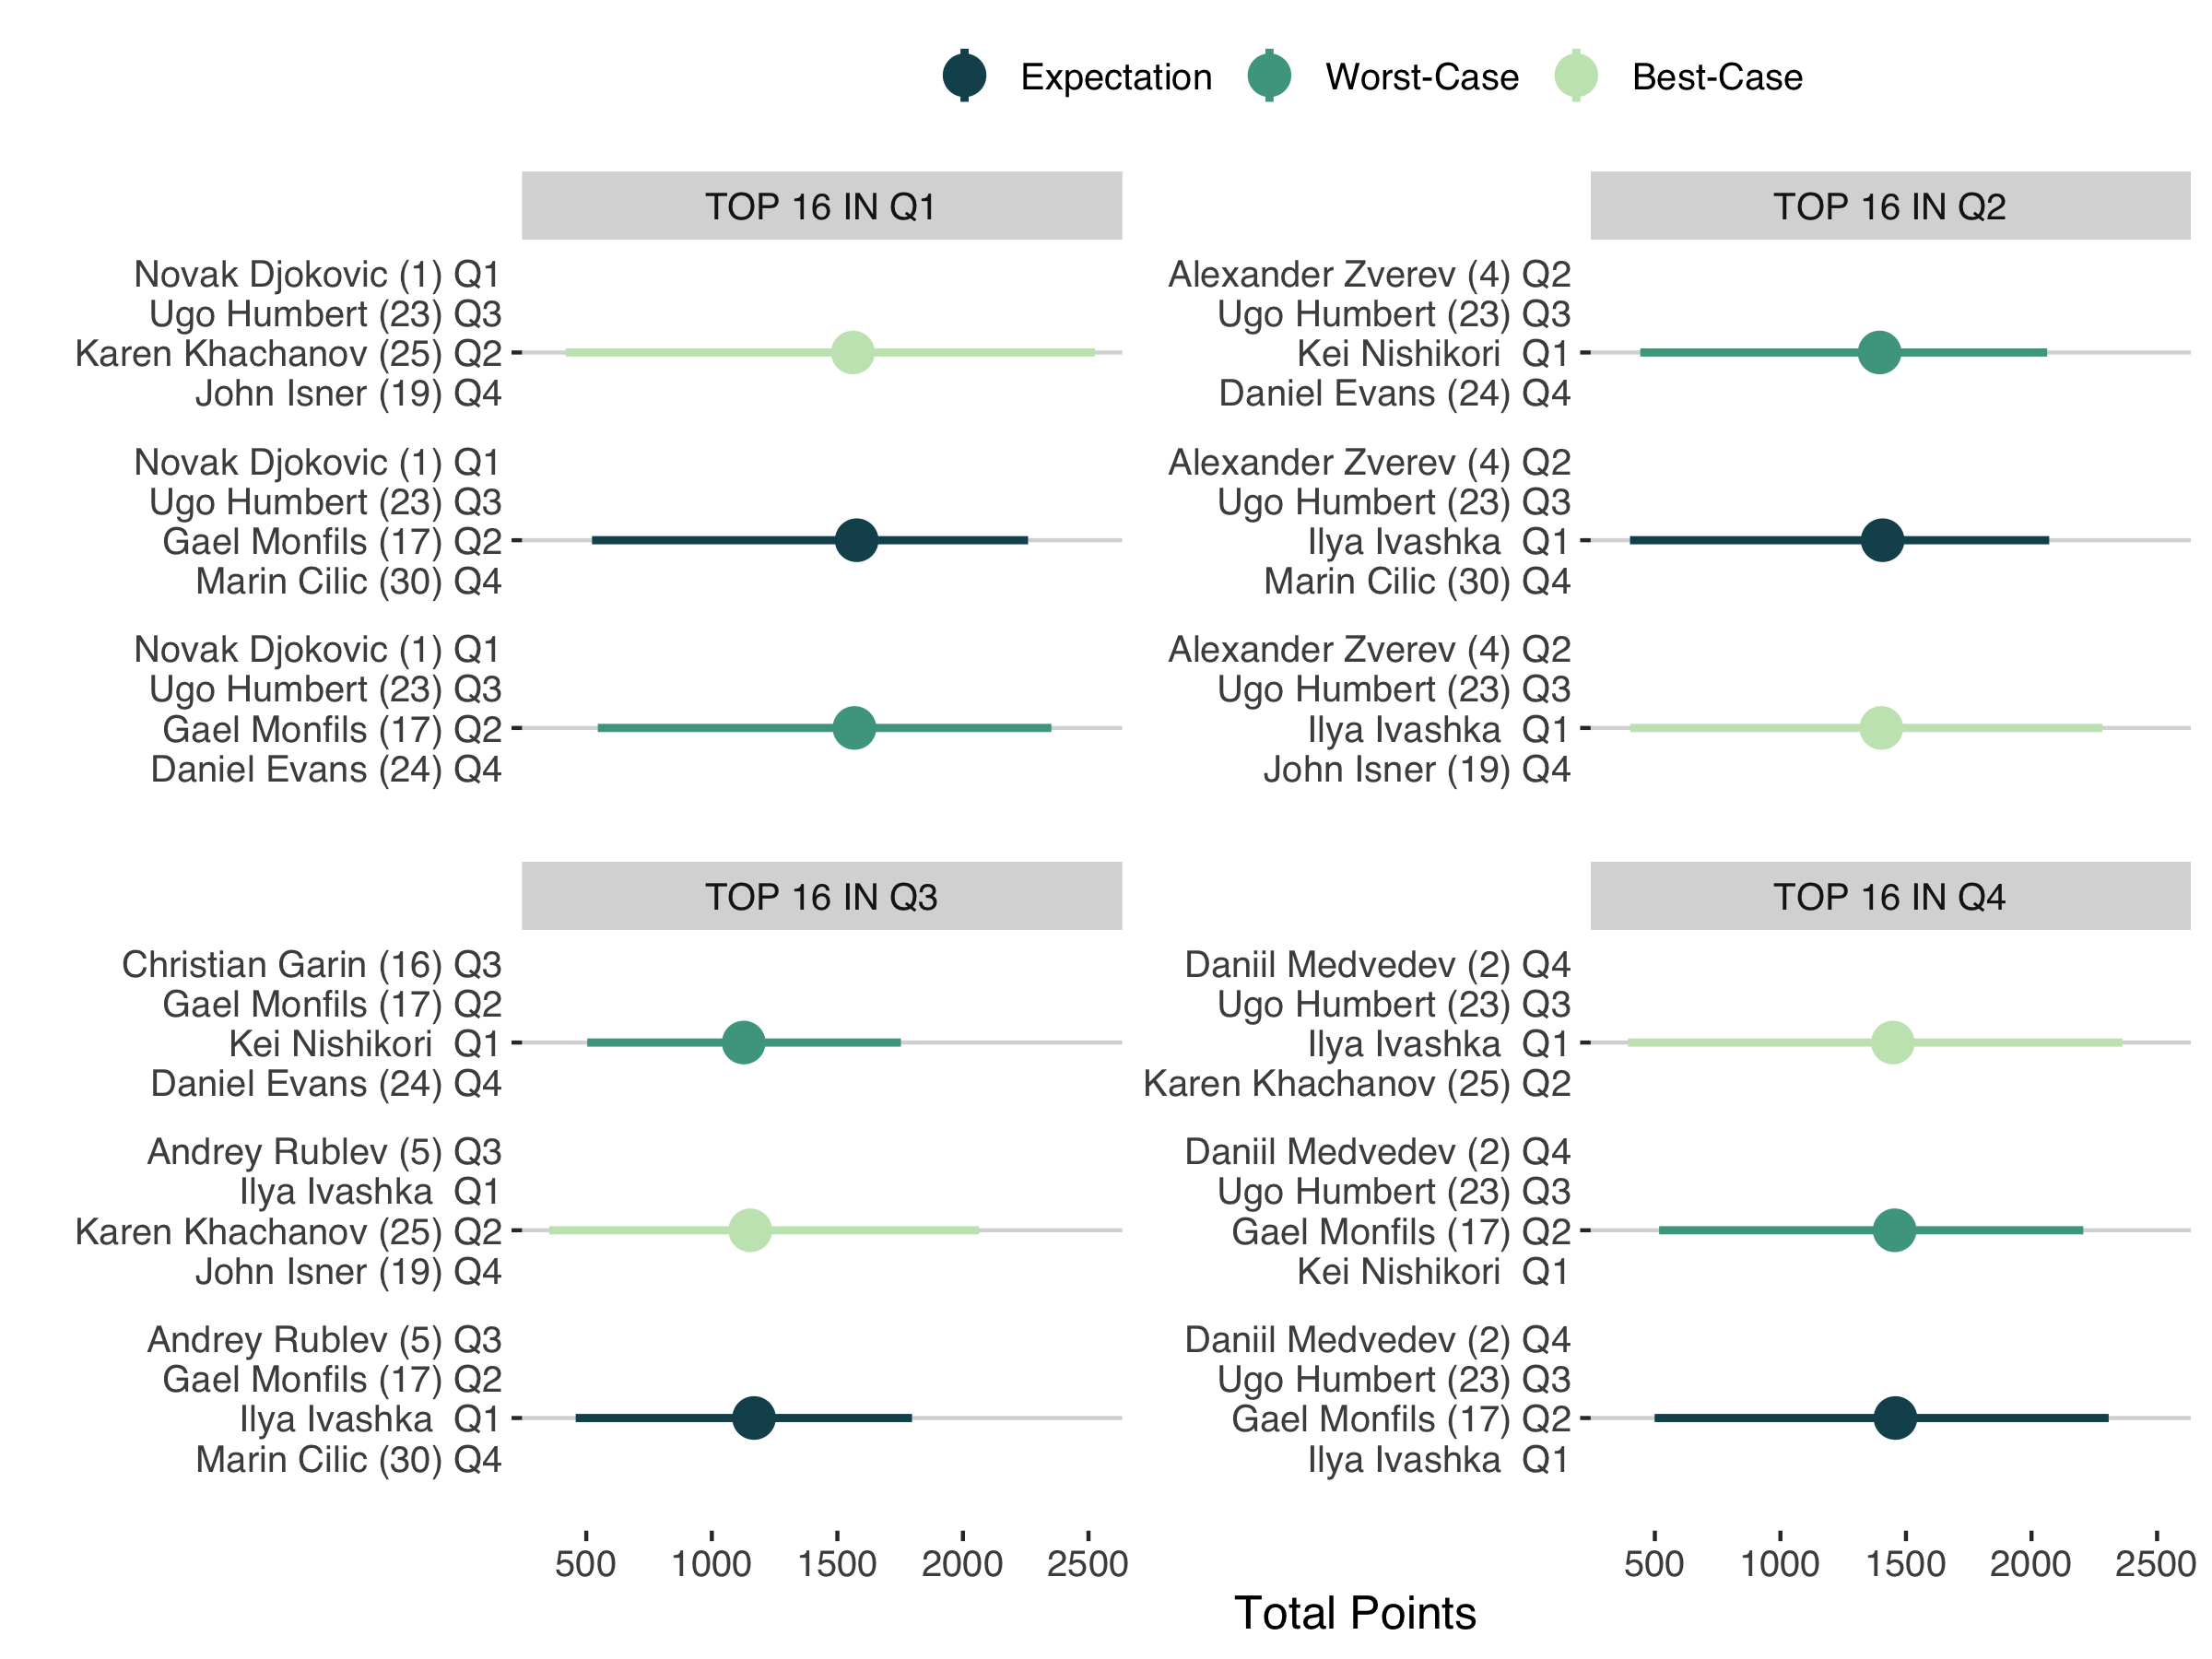
Still that is all pretty moot given the superior outcomes for the rosters anchored by Novak Djokovic or Daniil Medvedev. So that would have been a major decision point for the men’s roster this year: Djokovic or Medvedev. Outside of that choice, it is interesting that Humbert dominated the Q3 strategy, being the probabilistic best choice under all of the risk scenarios. That made the remaining two quarters the ones with the most options and greatest uncertainty.
On the women’s side, a probabilistically-guided roster would look pretty silly this year with such a fairytale result for Leylah Fernandez and Emma Raducanu. In fact, Fernandez would not even rank in the top 32 on expected points while Raducanu would just edge out the 32nd spot. At the start of the event, Osaka and Barty would have been the top statistical choices for building rosters around, with both players expected to get at least two wins even in the worst-case scenario.
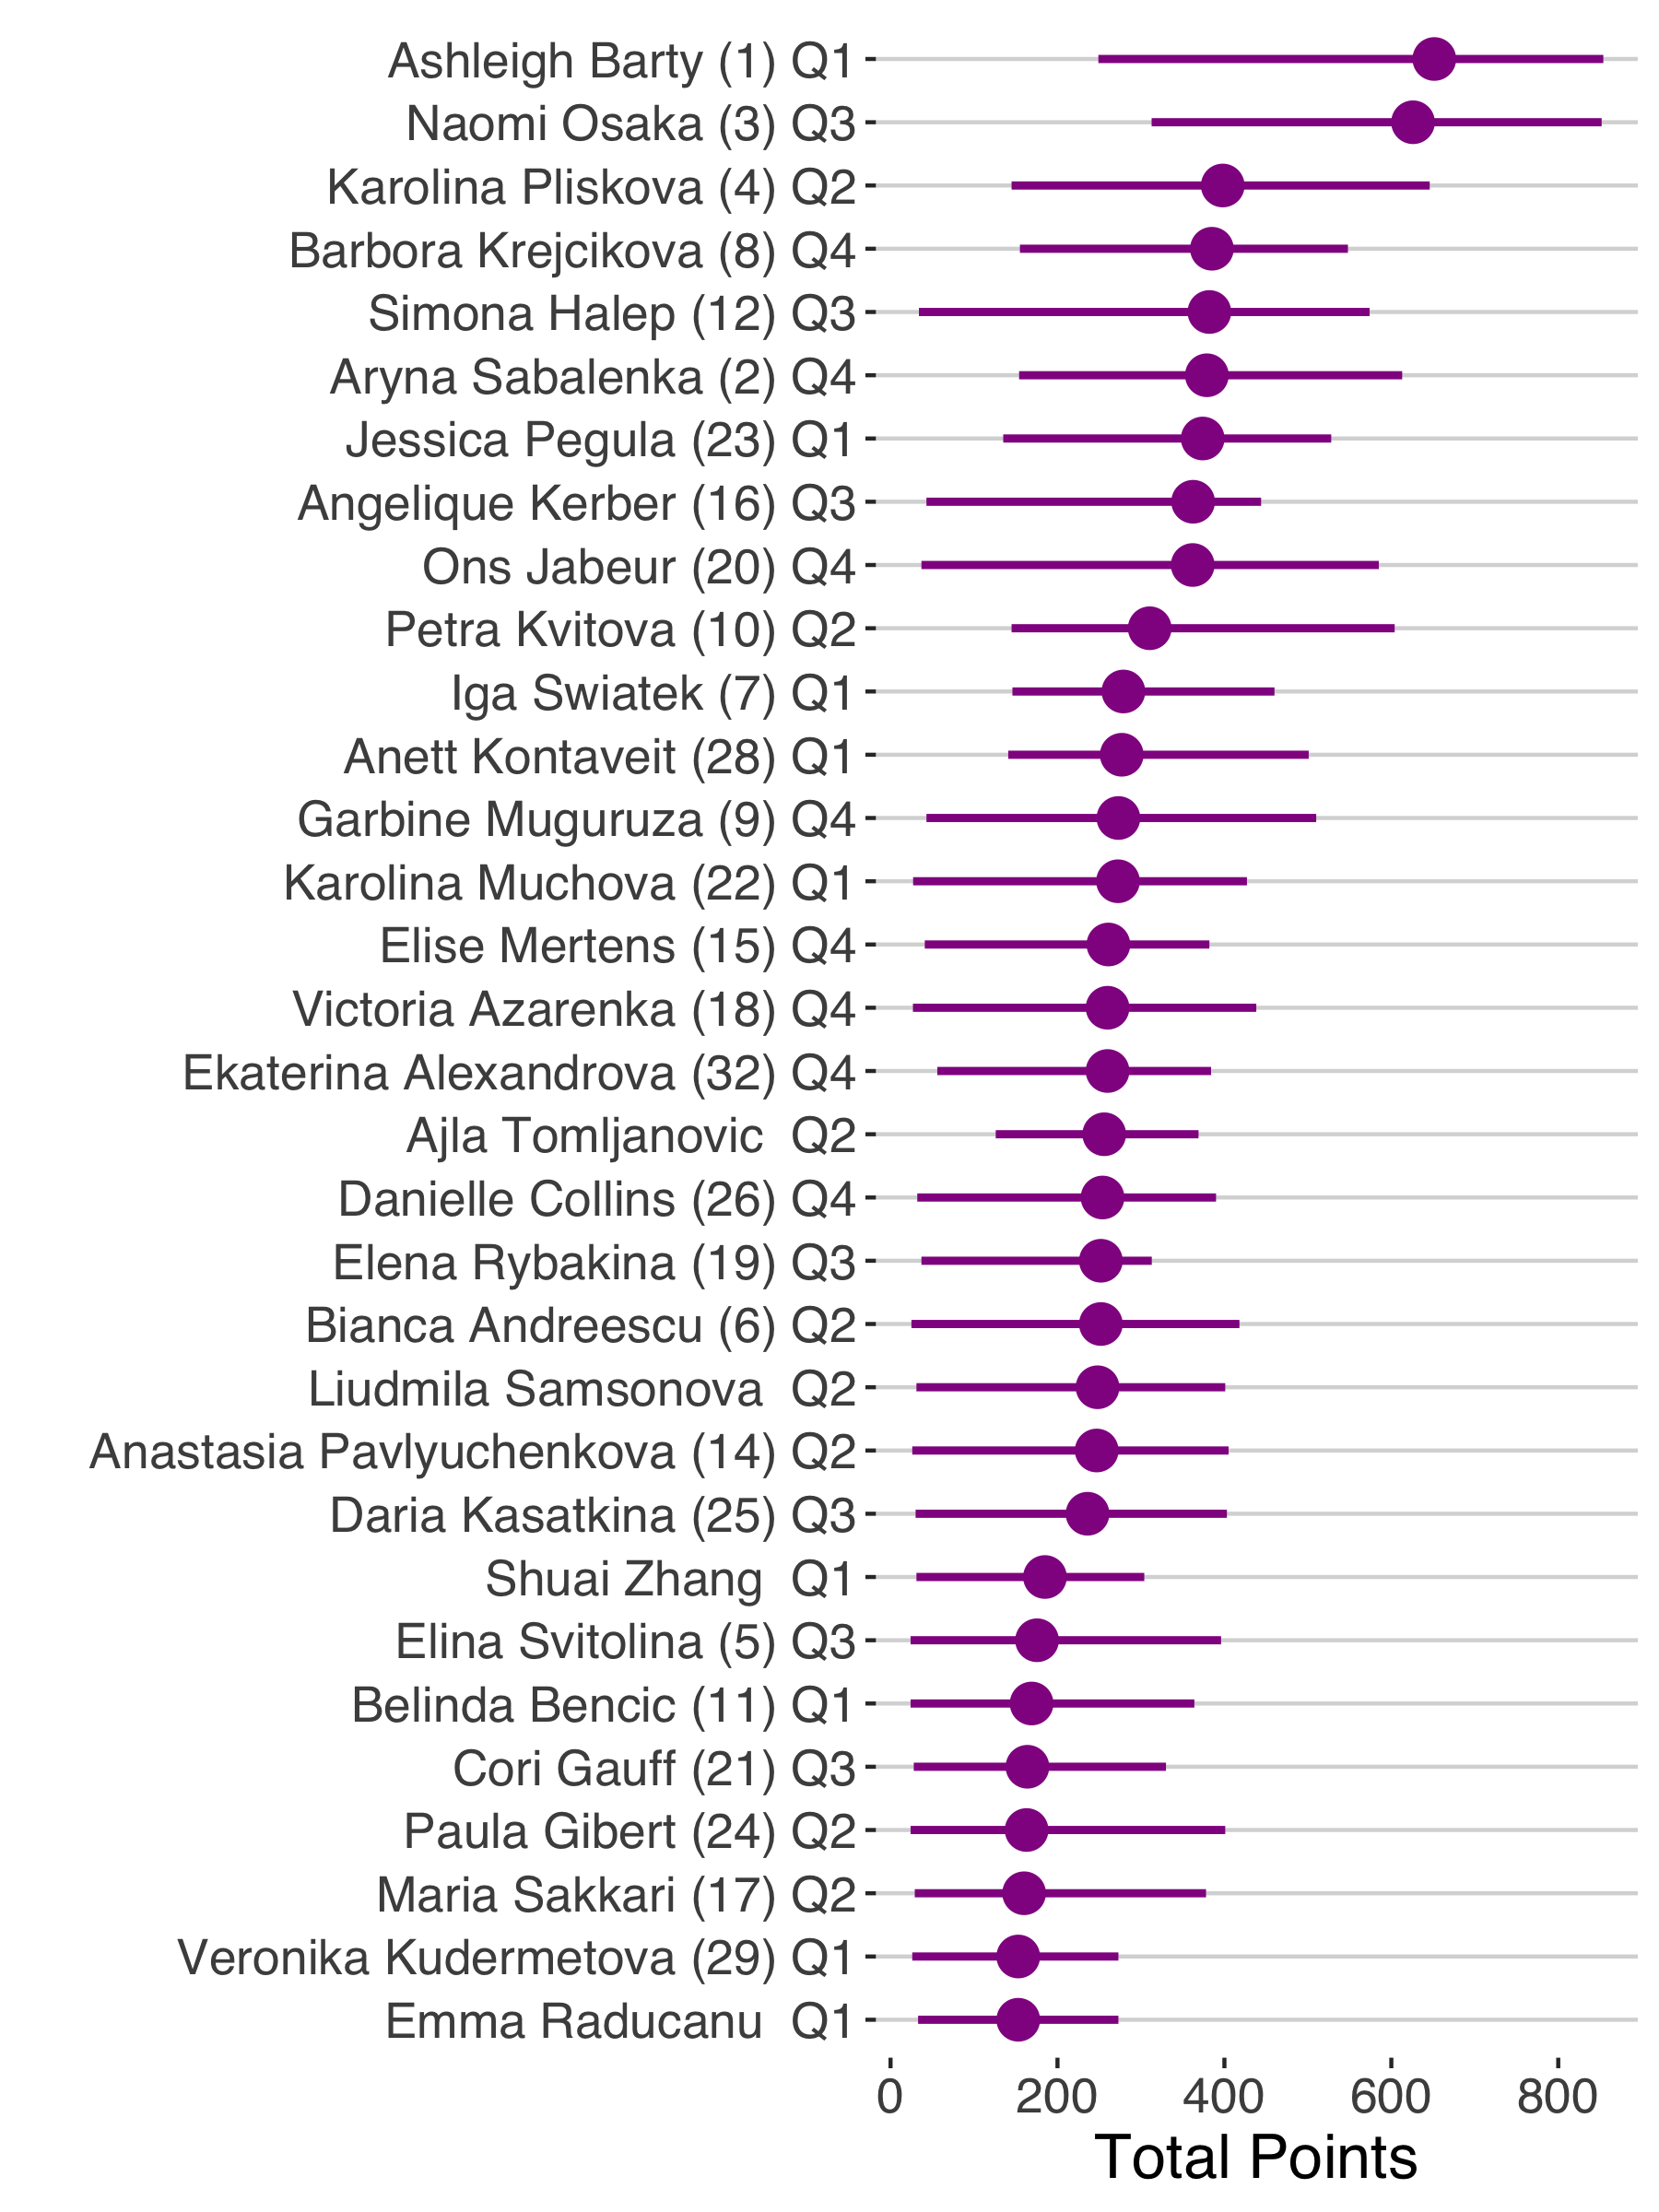
It’s noteworthy how clustered the distributions of the top fantasy prospects were on the women’s draw. Outside of Osaka and Barty, the top 32 expected points are all within the range of 153 to 398, meaning there was just a 245 point spread separating the expected total fantasy points among 30 of the top women’s players. Contrast that with the 390 points separating the expected points of the top 30 men’s players after Djokovic and Medvedev.
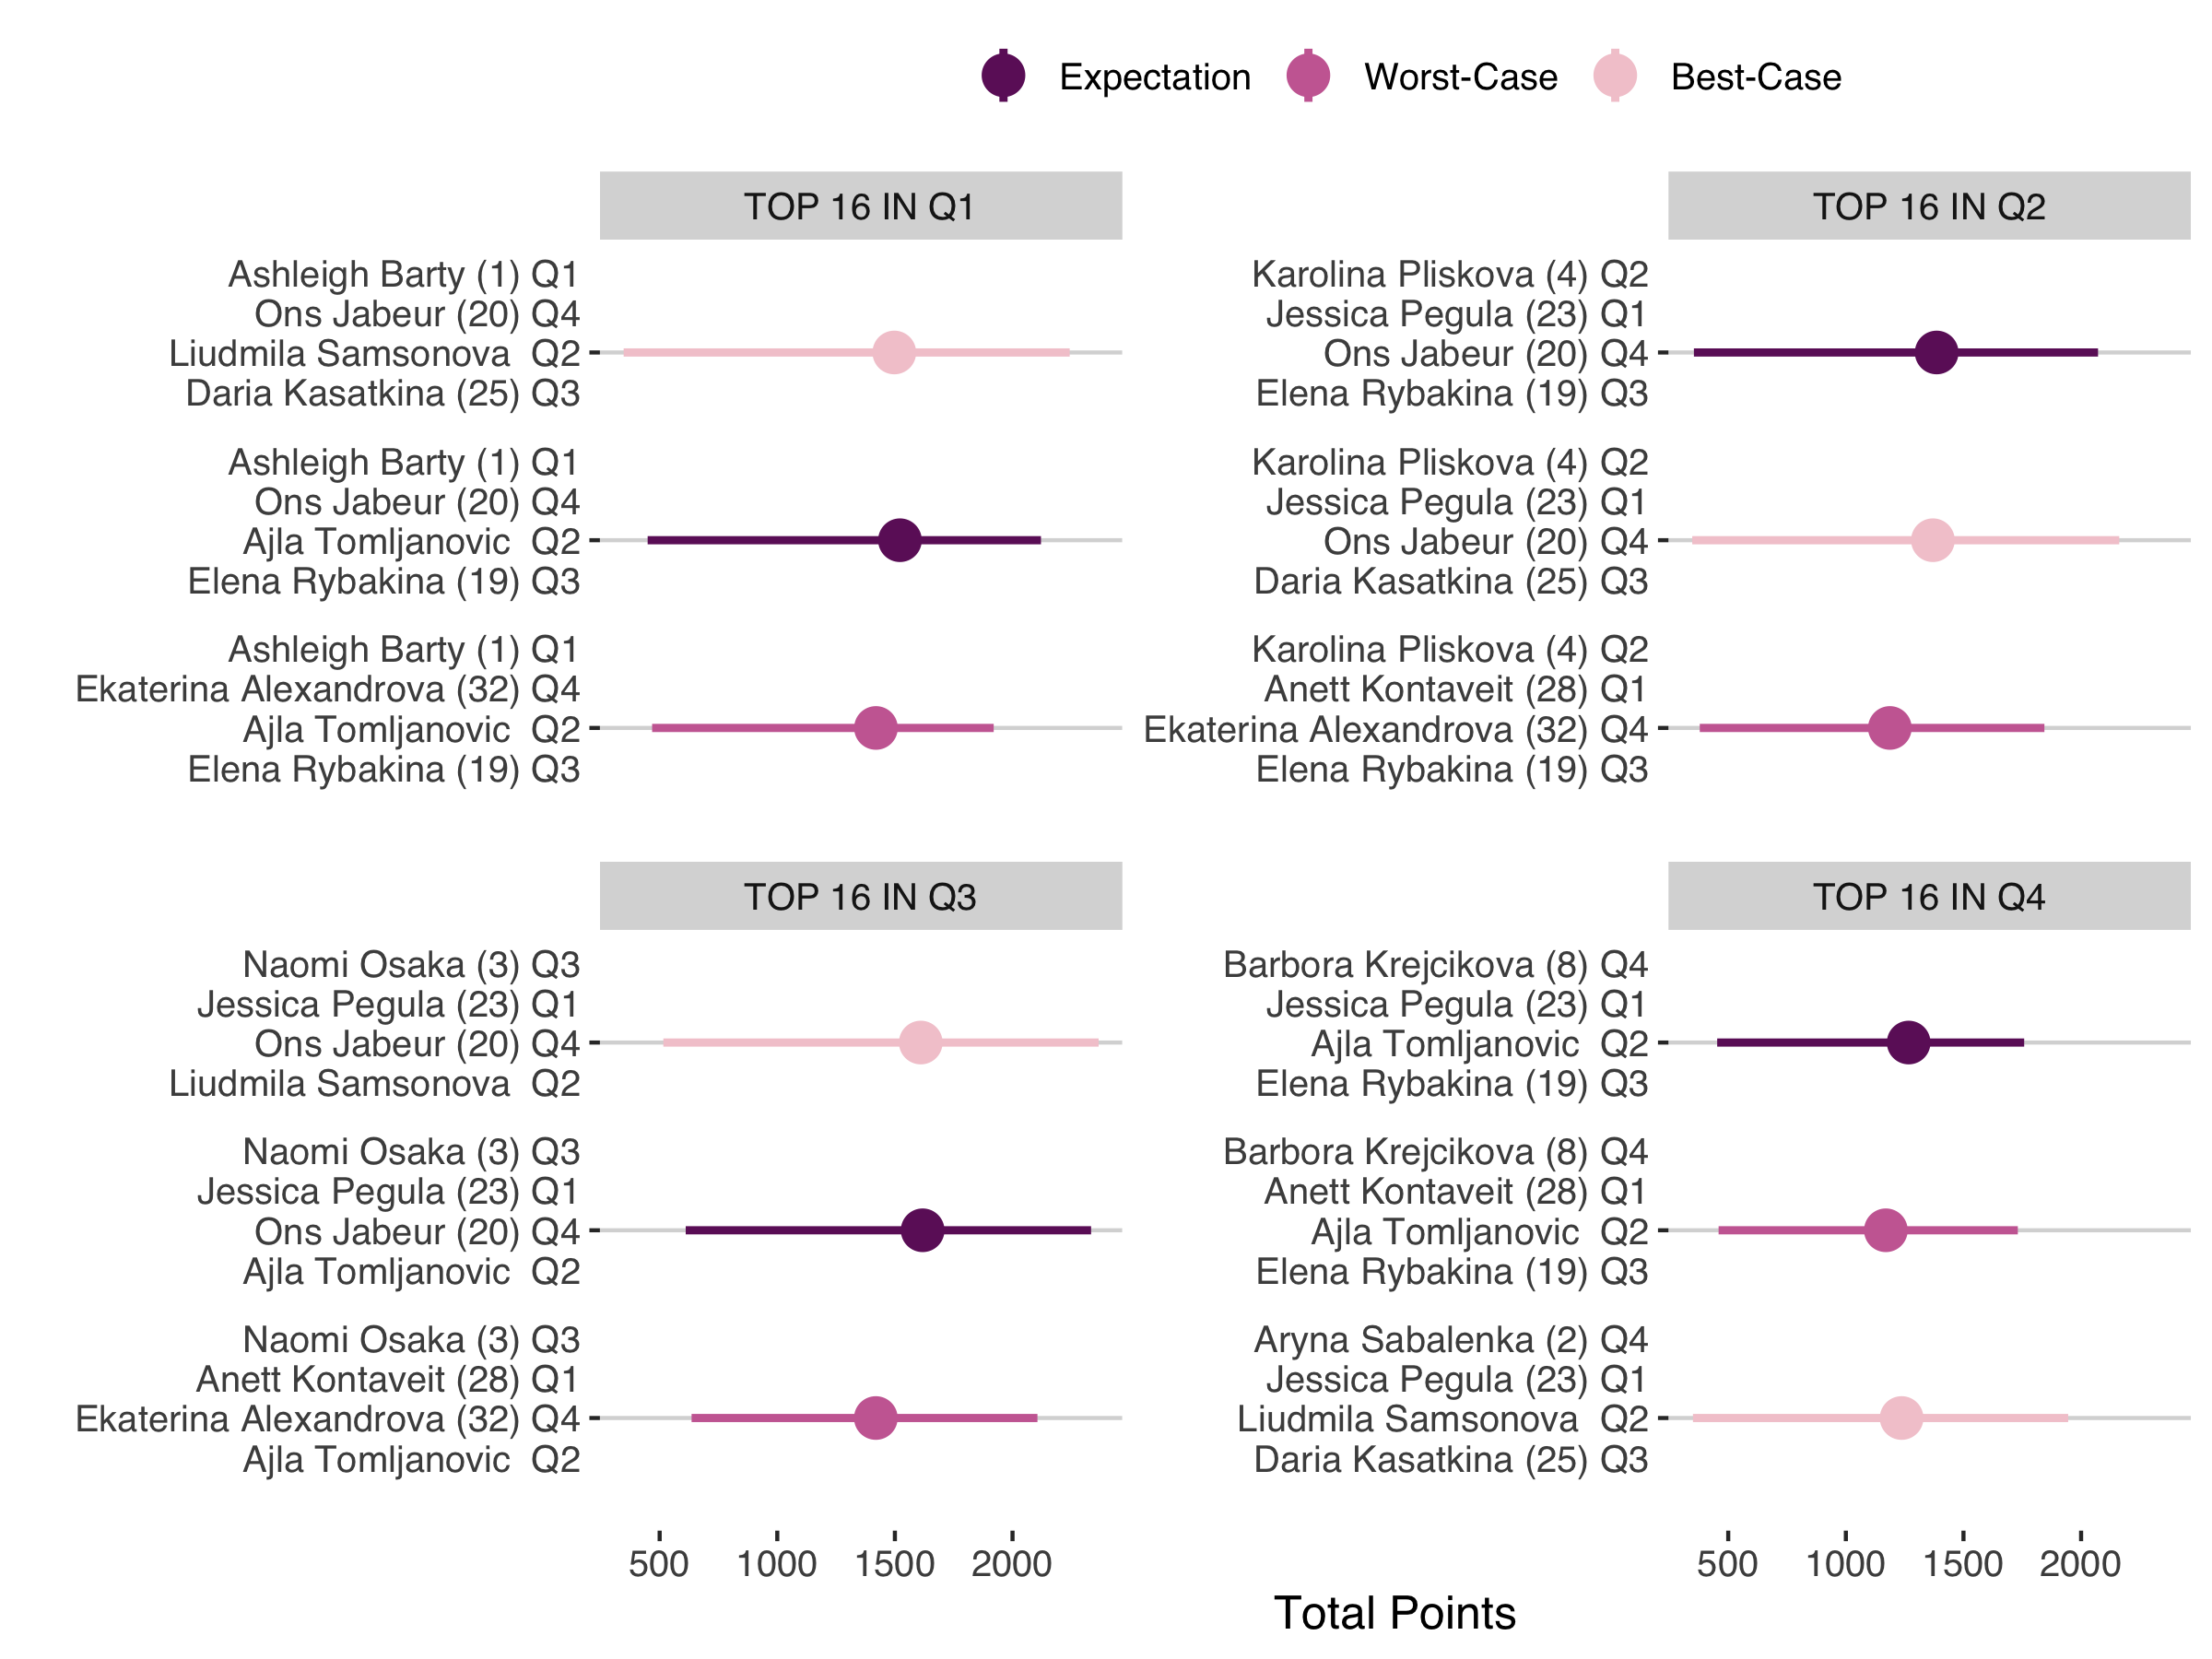
As you might expect, this results in more variety of roster options under the different risk approaches. On the women’s side, there was the most uncertainty in the top seed choice for Q4 where Krejicova or Sabalenka would both be reasonable choices under different risk strategies. We also find no player outside of the top 16 dominating all risk strategies in any of the quarters.
My attempt at a fantasy simulator shows how we can factor in point weights, the luck of the draw and match statistics when evaluating the best prospects for a fantasy roster. In the case of the US Open rules, we see that match wins was the major stat determining point outcomes, and this put a huge weight on predicting who will make it to the latest rounds. A statistically-based approach would have held up well on the men’s side but been crushed on the women’s side in the first year in Grand Slam history that a qualifier took the title. It’s a stark reminder that the quality of a betting strategy can’t be judged by just one trial and that leaving room for some surprises may make for a more robust roster in the long run.