Does Consistency Win Slams?
With 7 consecutive match wins standing between a pro player and a Grand Slam title, it would seem obvious that consistency in performance is essential to a major win. But no player can play to their best in every match. And no player can avoid the occasional off day. This raises a more interesting question with a less obvious answer: what level of consistency must a player maintain to win a slam?
‘Consistency’ is a trait that is if often used in conversations about tennis players. It’s what we usually mean by a player who can be relied on to deliver a similar level of performance from match to match, for better or worse. Asked on the spot, I’m sure any avid tennis fan could come up with a handful of ‘inconsistent’ players (think Monfils, Fognini, or Kyrgios, for instance). The list of consistent players is a no-brainer with each of the careers of the Big 3 defined by their mastery of consistency.
We all have a pretty good idea of what consistency in tennis means and that it is an important trait for a champion, yet it is one of those things that we don’t spend a lot of time trying to quantify. That’s a shame because reasonable measures of consistency shouldn’t be hard to come up with.
Just consider the illustration below. Imagine serve performance on one axis and return performance on the other. Each player is targeting the same goal on serve and return, highlighted by the red circle. Both players are hitting the target on average but the player on the left is within the target much more often than the player on the right.
This simple illustration makes the point that consistency goes hand in hand with variation. In fact, consistency is exactly the inverse of variance. The bigger the swings in a player’s performance — swings that can’t be explained by any knowable causes — the less consistent that player is.
There are many players that we could make the centerpiece of a conversation about consistency (or the lack thereof). One that I think makes a particularly interesting case for this topic is Aryna Sabalenka. The current World No. 3 has won 10 WTA singles titles in her career yet it took until this summer to earn her best result at a Grand Slam, a loss in the semifinal at Wimbledon.
Sabalenka has been in the conversation for a first slam title for some time, especially since 2018 when she broke into the top 15 of the WTA rankings and top 10 of WTA Elo ratings. Given the expectations that have surrounded her in recent years, the fact that she has been a match win away from a slam final only once and done no better than a 4th round finish otherwise has been a disappointment. And cause to ask why Sabalenka hasn’t yet lived up to her potential at slams?
Sabalenka is a classic case of a high-risk, high-reward player. She is a ball basher with the ability to overpower any player on tour on a good day. Yet on another day, it wouldn’t be a surprise to see Sabalenka bageled by a lesser competitor. Sabalenka’s intimidating weapons are also one of her biggest weaknesses because playing such low-percentage tennis is incredibly hard to sustain. Add the inherent randomness of best of 3 Grand Slam formats to the mix and you have yourself the perfect recipe for inconsistency.
But maybe I’m leaping to conclusions here. What evidence is there actually that Sabalenka is a high-variance player?
To get at this, we can focus on one of the most relevant stats for winning matches: the probability of winning a point on serve. One way to define an inconsistent player is one who has high match-to-match serve win performance. That’s easy enough. What’s hard here is that we don’t observe a player’s true serve win probability in a match, we observe the percentage of points won on serve against a specific opponent, who is obviously going to influence those outcomes as well. So we need to correct for that, at a minimum. Here is a basic regression model to get a true serve performance:
$$ g(E[Serve]_{ij}) = \beta_0 + \beta_1 ( log(Elo)_{i} + log(Elo)_j) + \beta_2 ( log(Elo)_{i} - log(Elo)_j) $$
Here the $g(E[Serve]_{ij})$ is the logit of serve win percentage of player $i$ versus player $j$. We model the log odds as a linear function of the sum of the Elo ratings of the two players (on the log scale) and the difference in their Elo ratings (on the log scale).
Now we can look at performance adjusted for expectations: $R_{ij} = Y_{ij} - E[Serve]_{ij}$. This is simply the residual of actual serve win percentage against the expected. There is certainly more that could explain performance but this at least goes far in removing opponent effects when looking at match-to-match variation in serve performance.
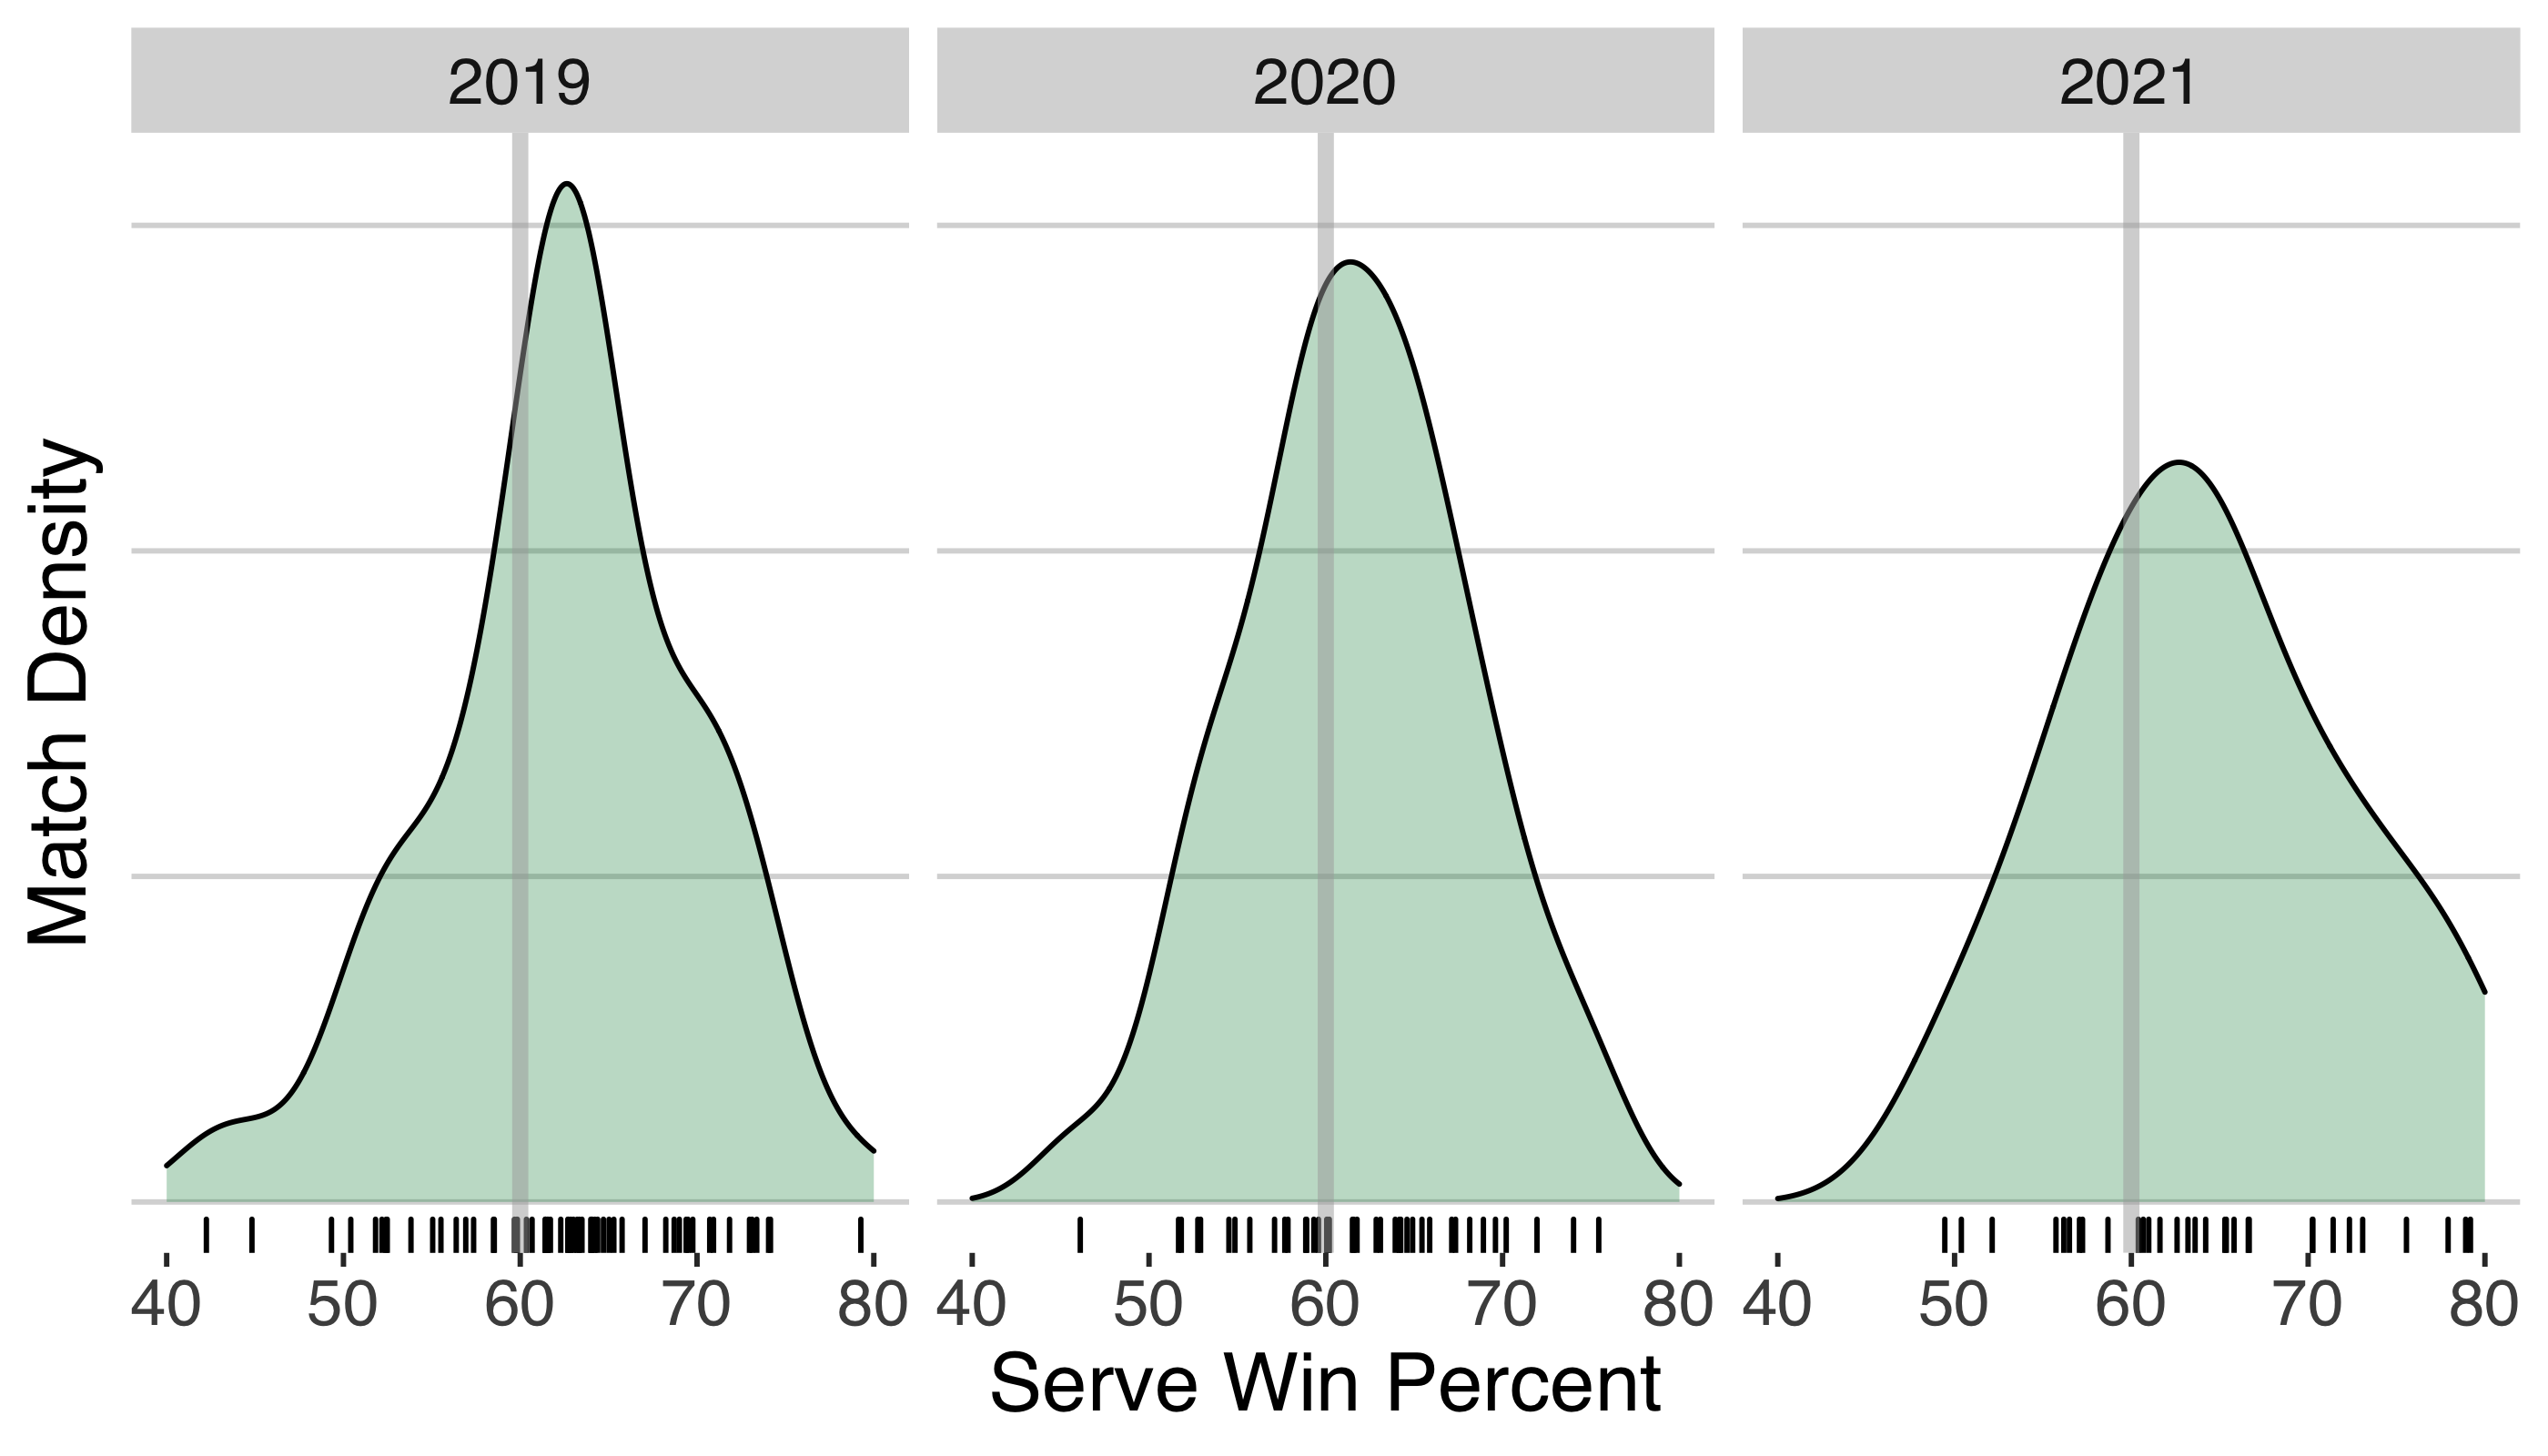
Below is the density of these residuals for Sabalenka’s matches from 2019 thru 2021, centered at a fixed 60% serve win in each year. There is some difference from year to year but in all years we see multiple match results that are more than 10% below and above her average. Interestingly, there is more skew in 2021 and the upper end of her performance swings up to 20% above her average.
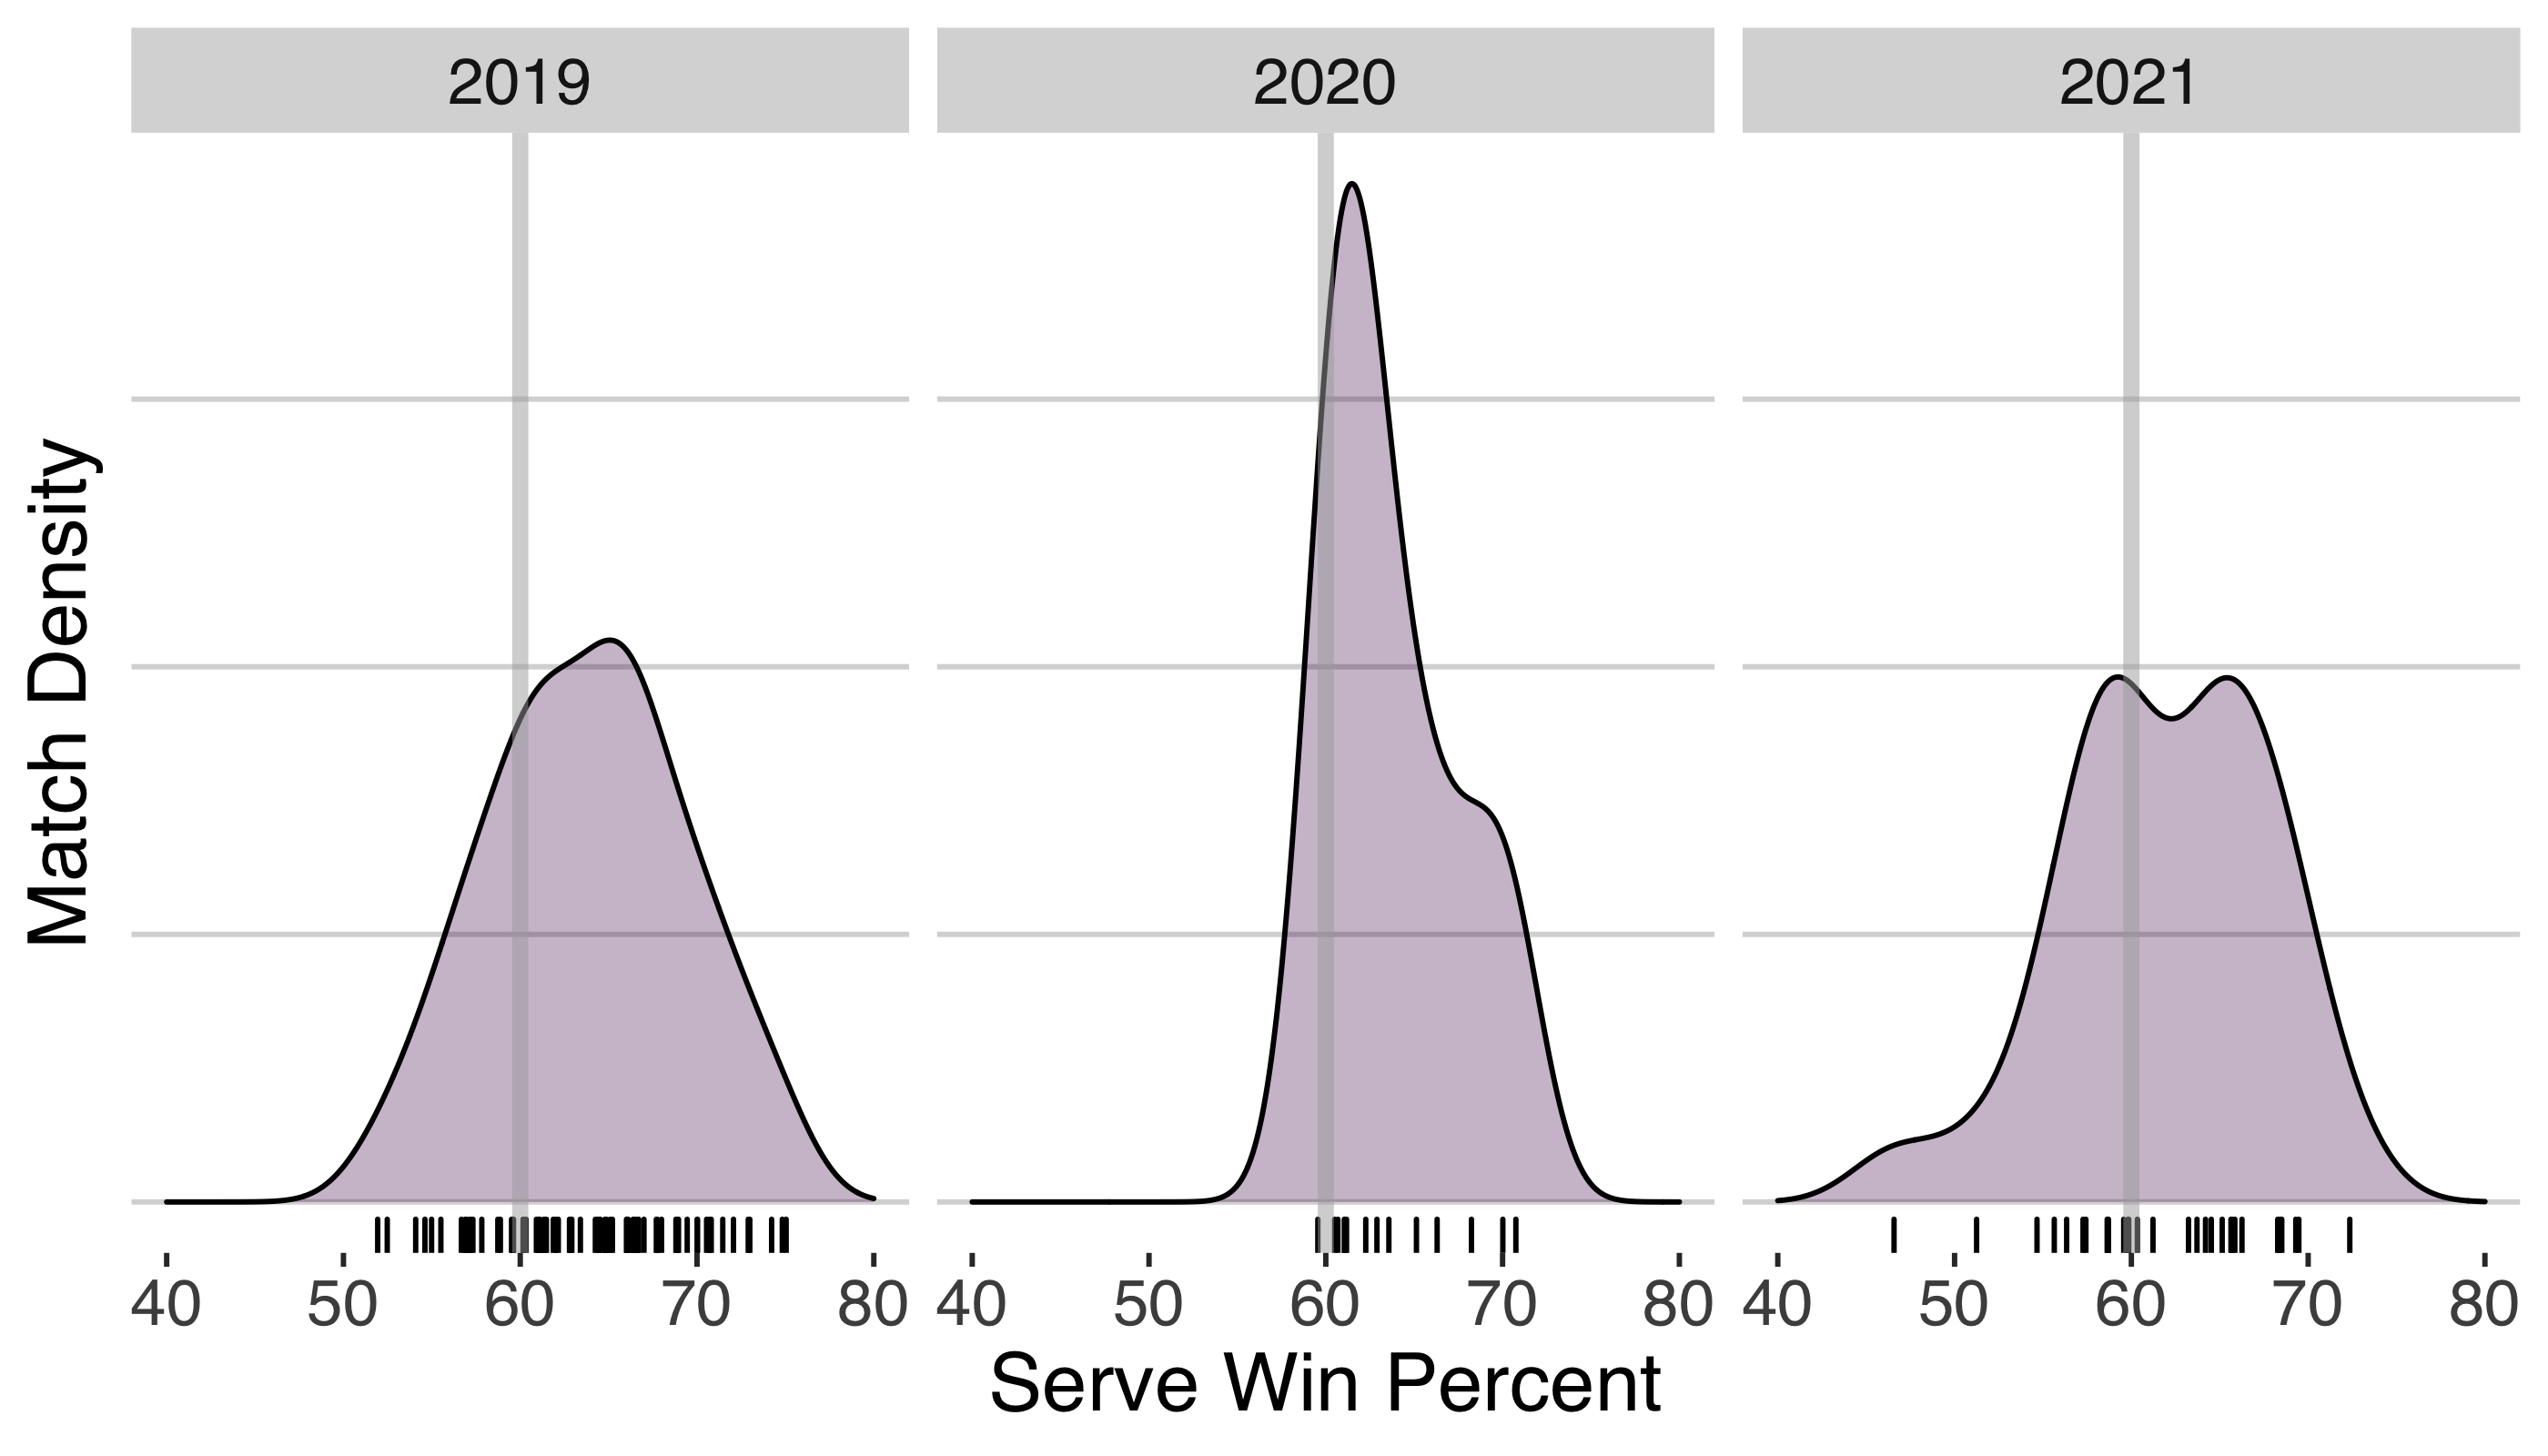
So we are looking at performances on serve that could be anywhere on a 20 to 30% range. That seems big but is it really? Well let’s contrast with another top player, Ash Barty. Immediately we see much narrower densities for Barty with 2020 and 2021 in particular spanning a range closer to 10%.
What I want to look at next is to what extent the level of variation we see in Sabalenka’s serve performance could be making the path to a slam title that much harder?
We know that point outcomes in tennis are strongly related to the serve ability of each player. Using this, we can build a tournament simulation for a best of 3 Grand Slam that can let us see how changing the variation in Sabalenka’s serve and that alone influences her chance of a title win.
Tournament Simulator
- For each match over 7 rounds…
- Step 1. Draw $p_0$: the serve probability of opponent from a low-variance distribution with an average at 55%
- Step 2. Draw $p_1$: the serve probability for ‘Sabalenka’ from a distribution with an average of 60% and variance based on the consistency condition
- Step 3. Simulate tennis match given $(p_0, p_1)$ and determine winner
- Repeat Steps 1 thru 3 1,000,000 times to get a distribution for the Grand Slam outcomes under the given consistency condition
By assuming the same strength of opponent for all matches, we aren’t reflecting the actual reality that opponents should generally get more difficult with each round. So are absolute win chance won’t be a good estimate for the real case. But this simplification shouldn’t prevent us from seeing how increasing variation in performance from match to match could make 7 consecutive match wins relatively harder.
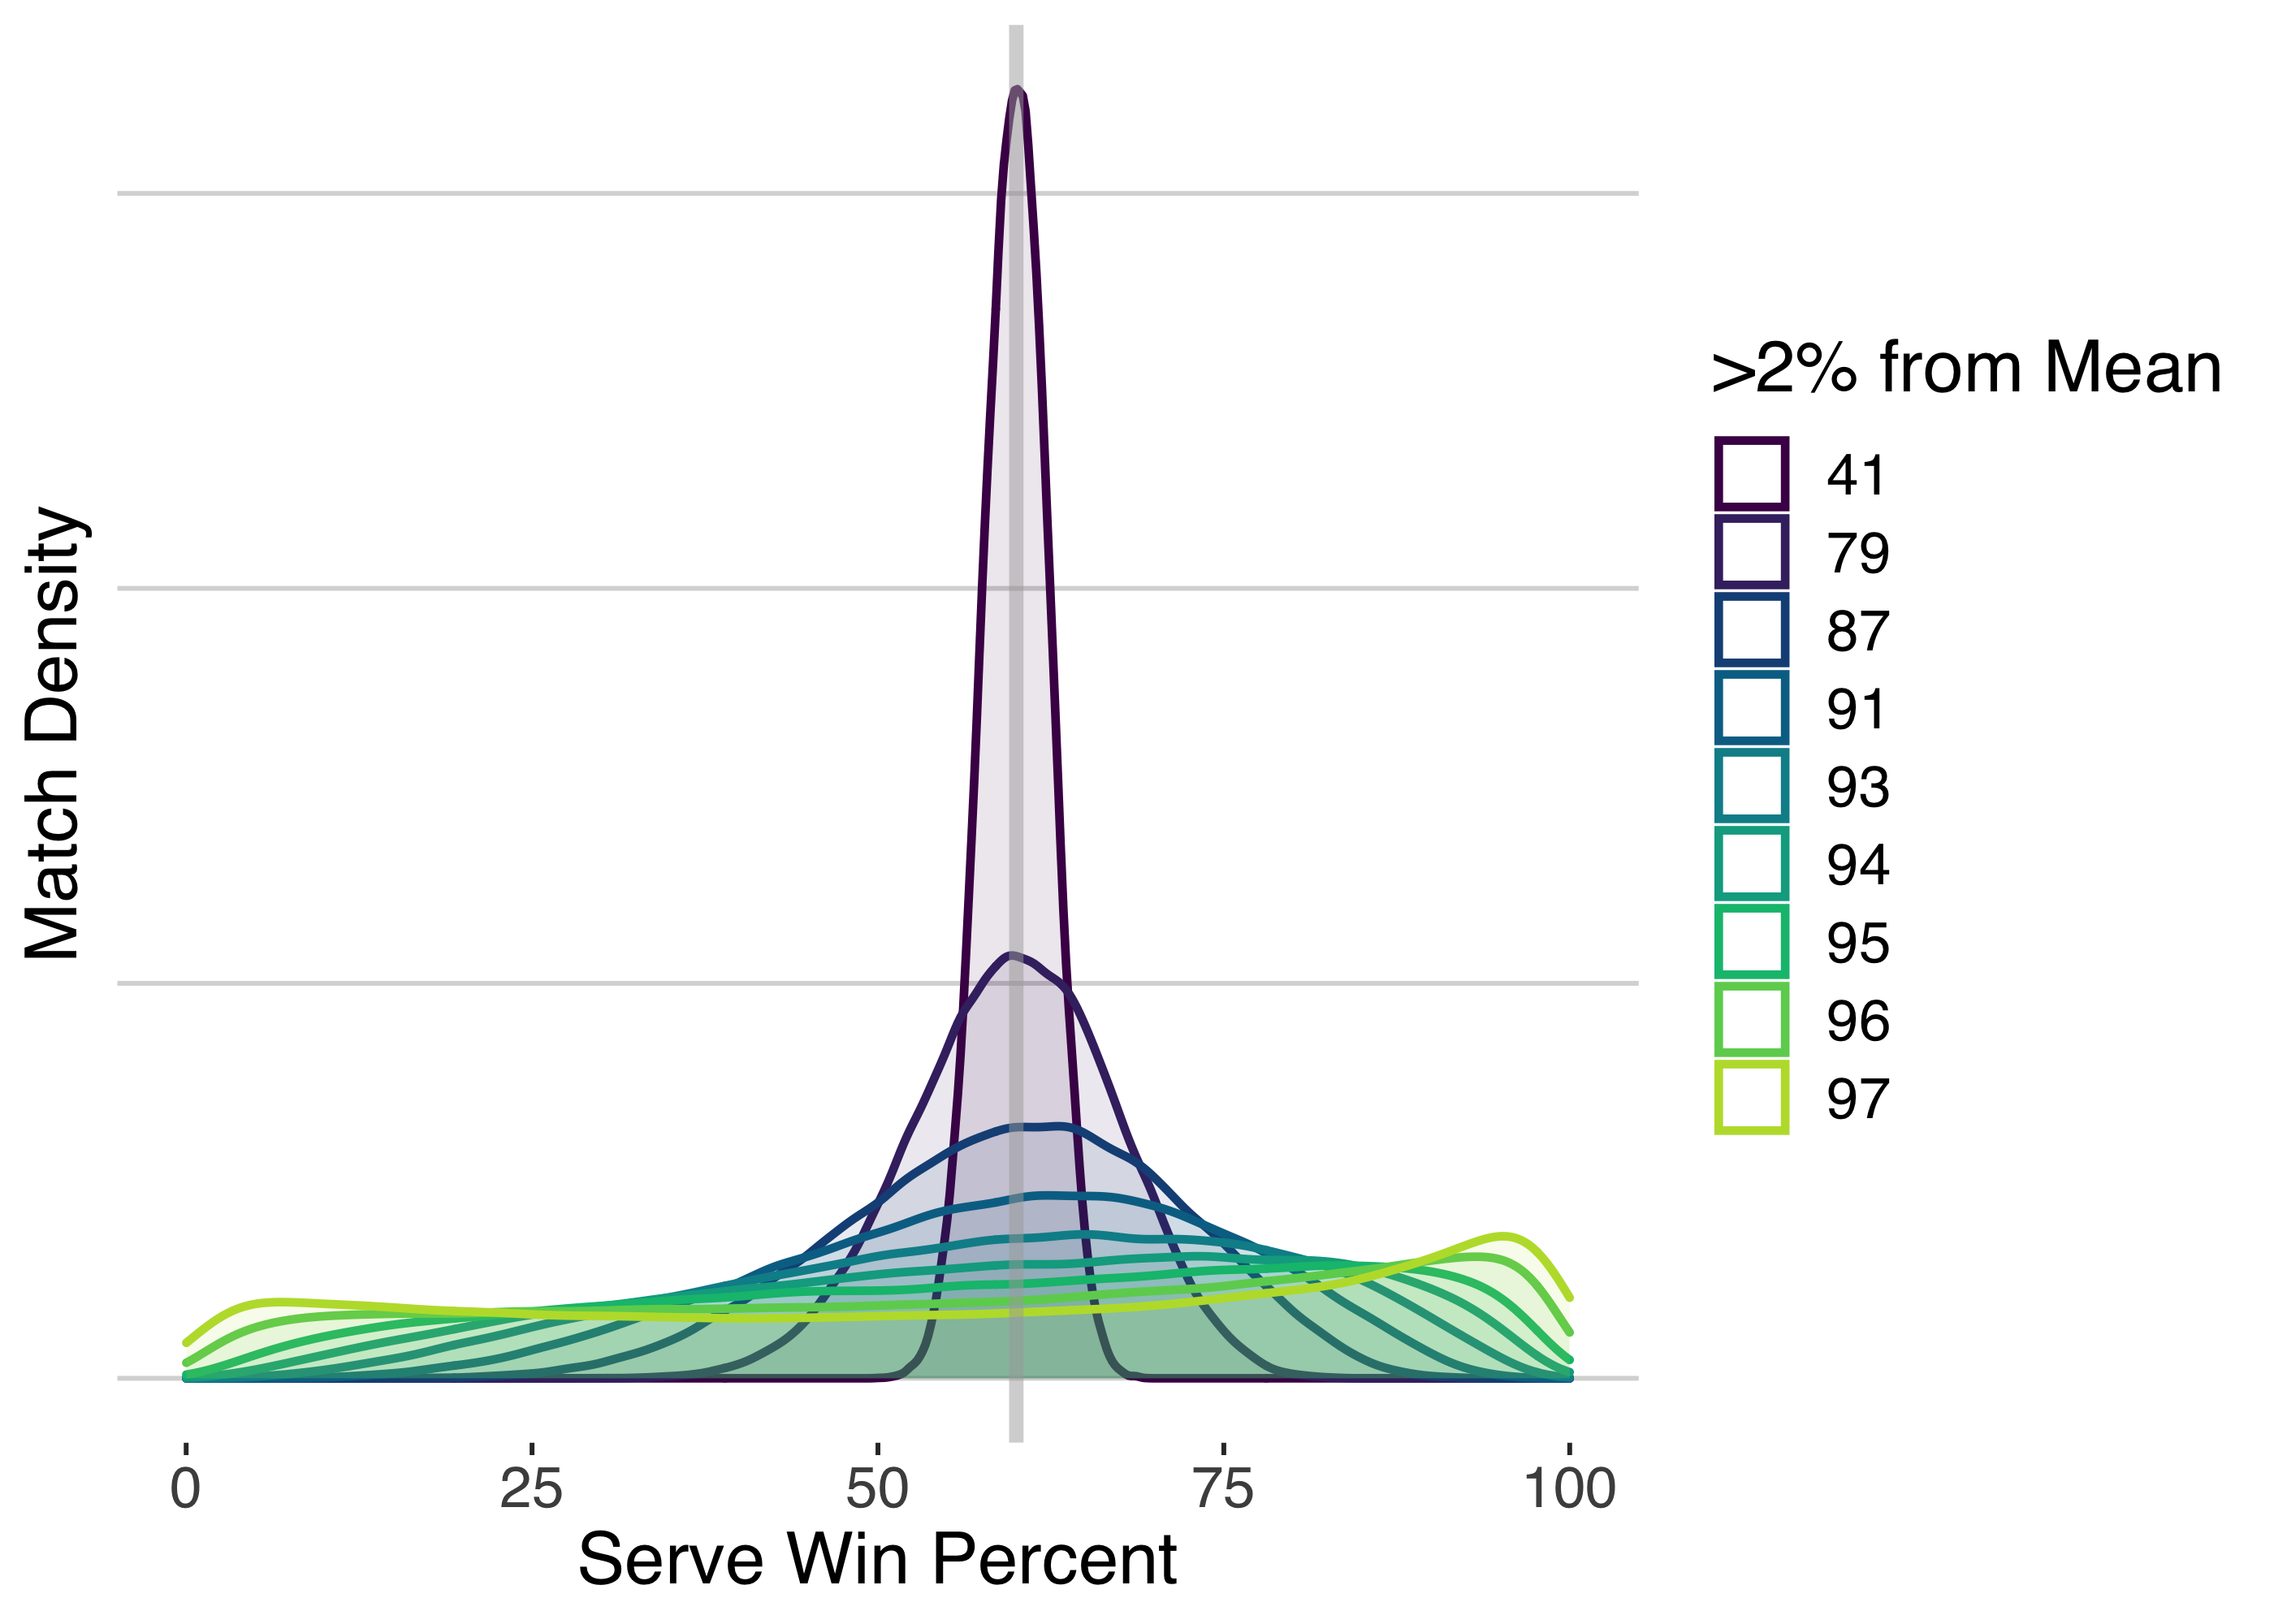
What are the consistency conditions that I considered? There were a total of 10 and the distributions of the serve probability are shown below. The colors indicate the inconsistency in terms of the frequency that a match serve win chance is more than 2 percentage points away from the mean. It is a bit arbitrary but I think a measure that is easier to wrap our heads around than the standard deviation. The most consistent case has 40% of match performances outside this range while the most inconsistent has 97% of cases more than 2 percentage points away from the mean.
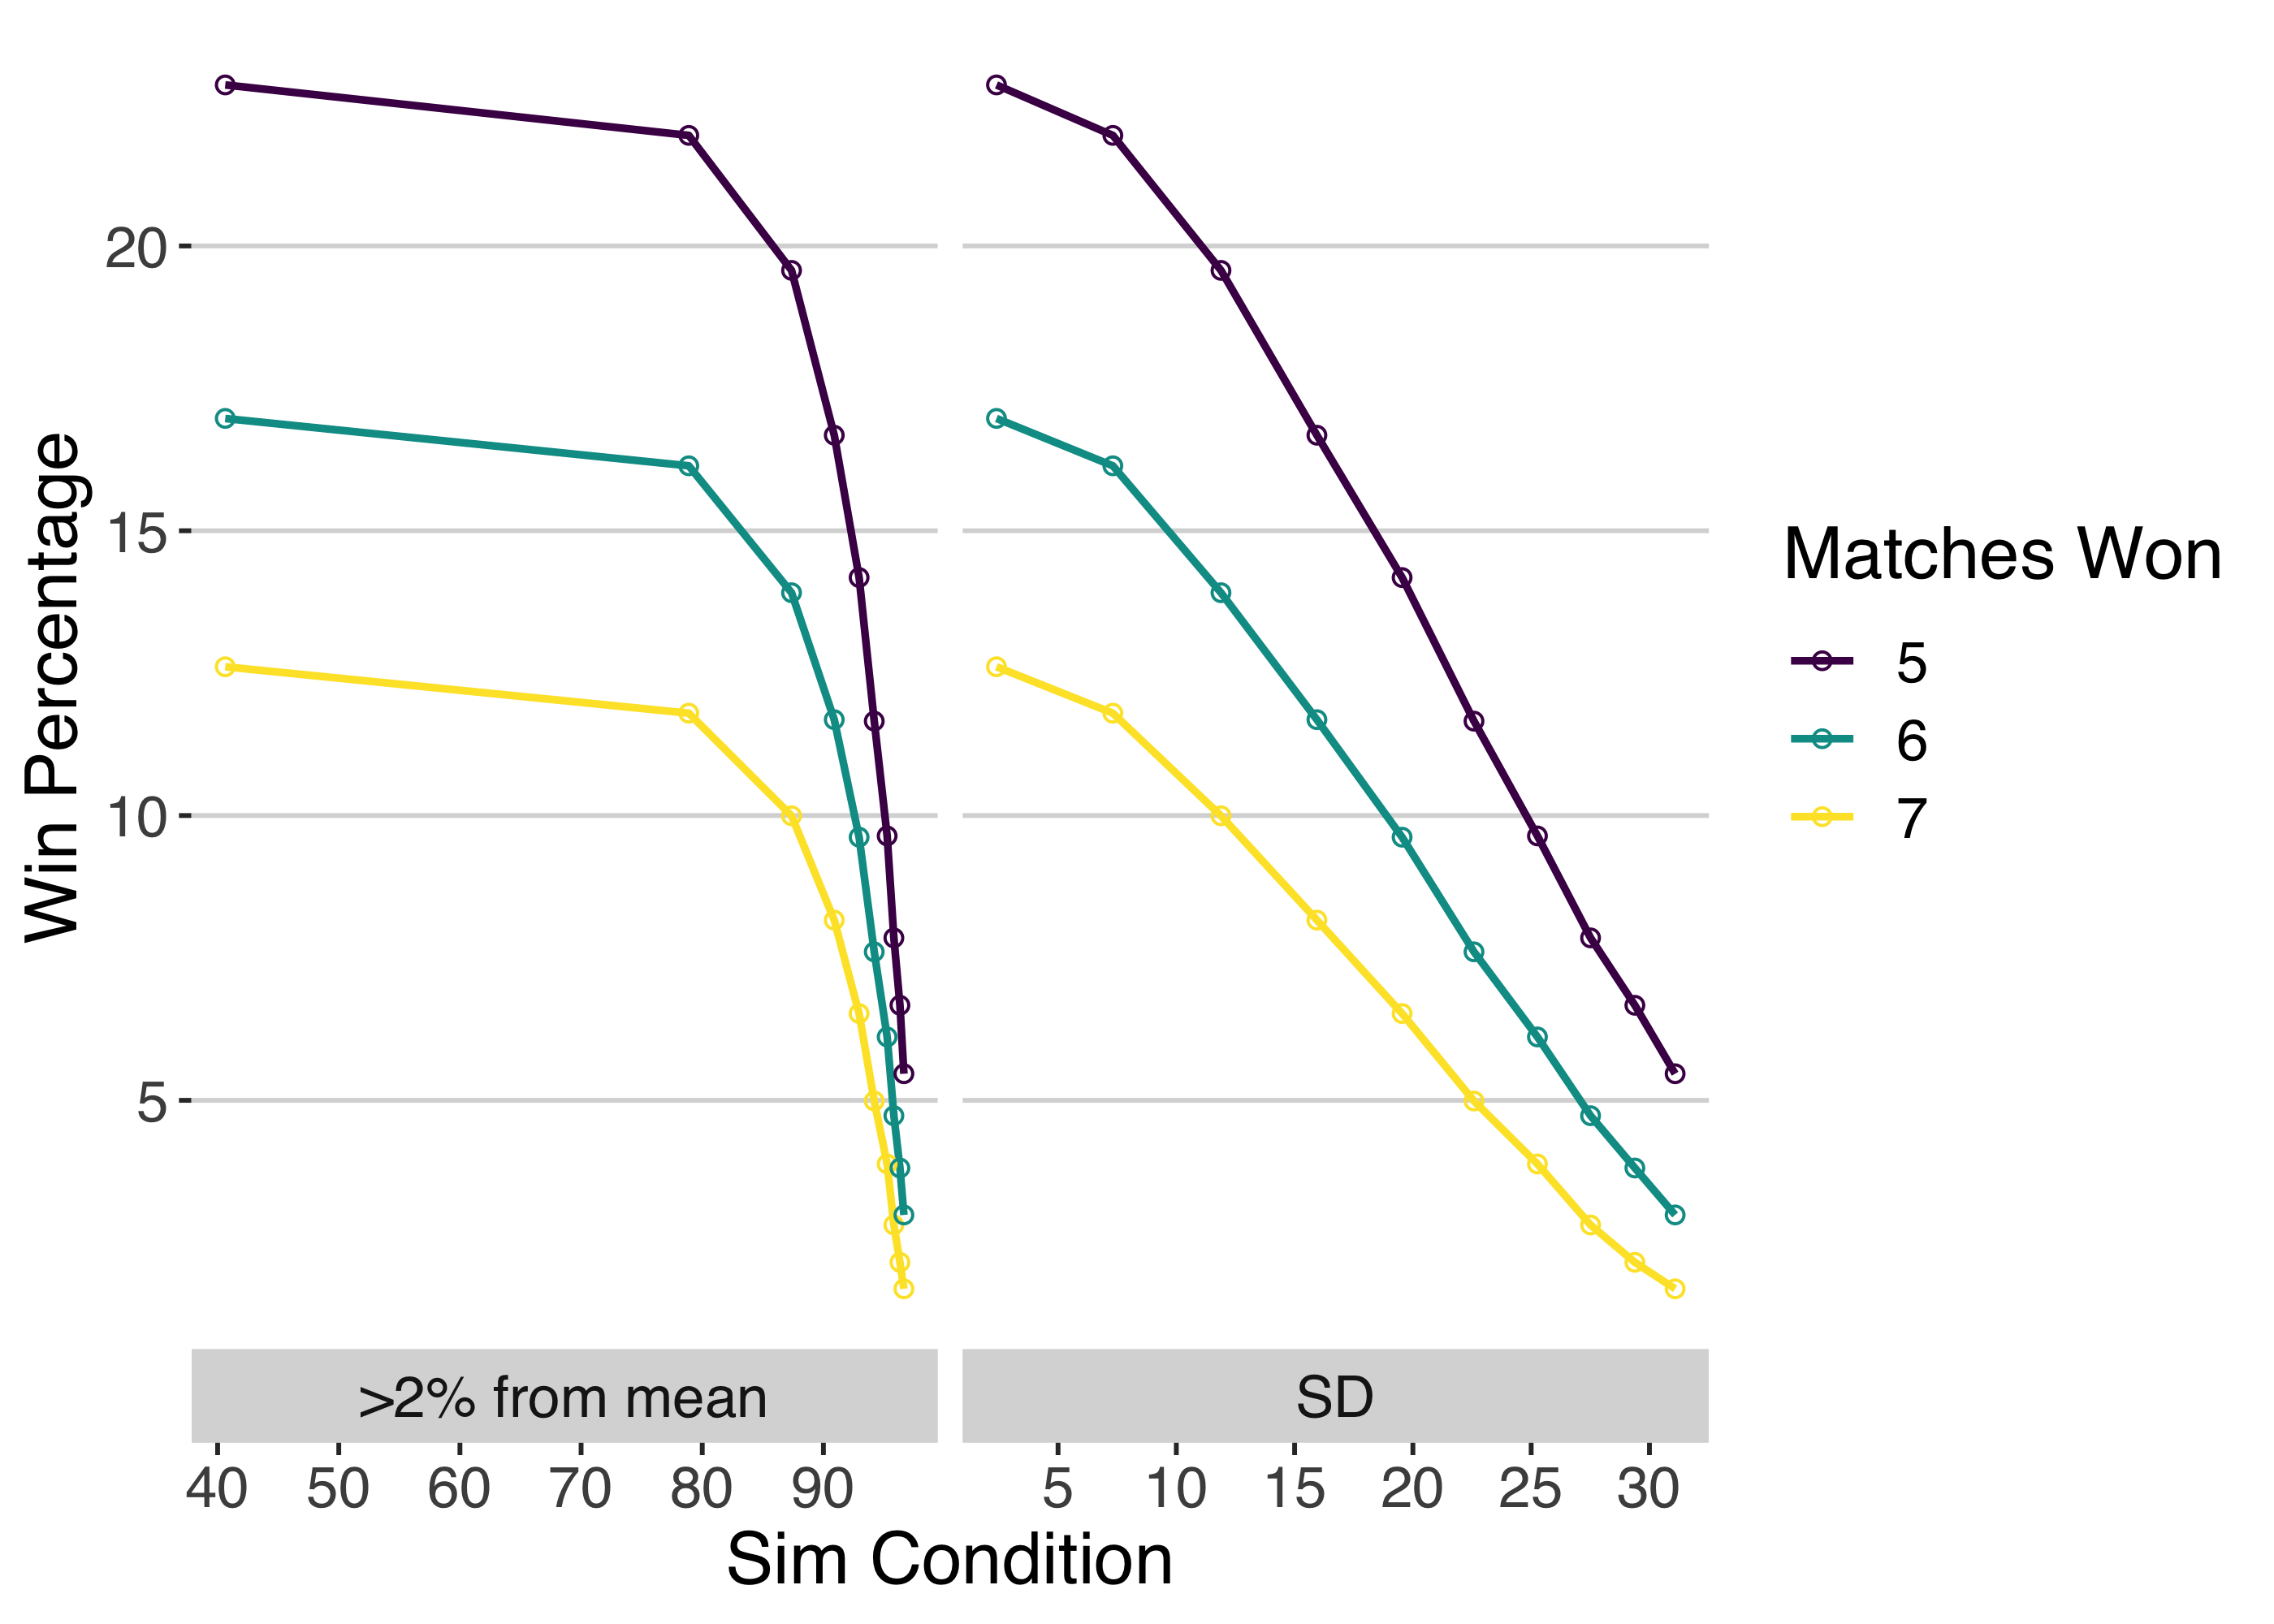
And the punch line…Starting with a slam title and 7 consecutive match wins, we see a clear negative effect of inconsistency. In fact, in terms of the 2% region, there is a steep drop off once more than 70% of performances are more than 2 percentage points from the mean. In relation to the standard deviation in performance, the title win chances are close to linear and we see a drop in chances of about 2 percent with every 5 percentage point increase in SD. We see similar effects for 5 and 6 consecutive match wins though the overall win percentage is obviously higher for each condition.
Now, these are extreme consistency conditions. In reality, Sabalenka is probably somewhere in the 10 to 15 point SD range so, supposing she could reduce that variance by half, we are looking at a gain of several percentage points in her overall win percentage. Not a massive contribution but, with only 4 opportunities a year at Grand Slams, it is a difference we can’t shrug off.
This small study of one aspect of consistency shows that the tournament simulator is a useful tool for investigating questions around match-to-match variance. And there are many more questions worth exploring.