Are Women as Pythagorean as Men in Tennis?
Last week, based on work presented at the 2015 NESSIS, I wrote about an extension of Pythagorean Expectation to tennis, which showed that break point conversion has a strikingly similar ability to predict match wins in tennis as runs predict team wins in baseball. The Pythagorean analyses were based only on the men’s tour. In this post, thanks to match statistics published by Jeff Sackmann of Tennis Abstract, I will examine the existence of a Pythagorean formula for women’s tennis.
Based on over 12,000 matches from 2010 to 2015—the era of the “Premier” tournament structure—, I looked at the Pythagorean strength of 14 performance measures. The “Pythagorean strength” is calculated with the following formula,
$$ Win% = X^\alpha/(X^\alpha + Y^\alpha); x; 100. $$
Here, $Win%$ refers to the season percentage of wins out of matches played. The $X$ in this formula is one of the 14 measures of player strength and is the total of that skill across all of a player’s matches in a year. $Y$ is the corresponding total for the opponents that player faced.
For example, if we consider the Pythagorean model for points won on first serve for Li Na in 2010, Na had 45 matches in the database in this year and won a total of 1,105 first serve points in those matches, while her opponents won 949 points. So, the Pythagorean expectation for Na in 2010 based on first serve points won would have $X = 1,105$ and $Y=949$. To complete the calculation, we need the exponent $\alpha$, which is estimated from a least-squares fit.
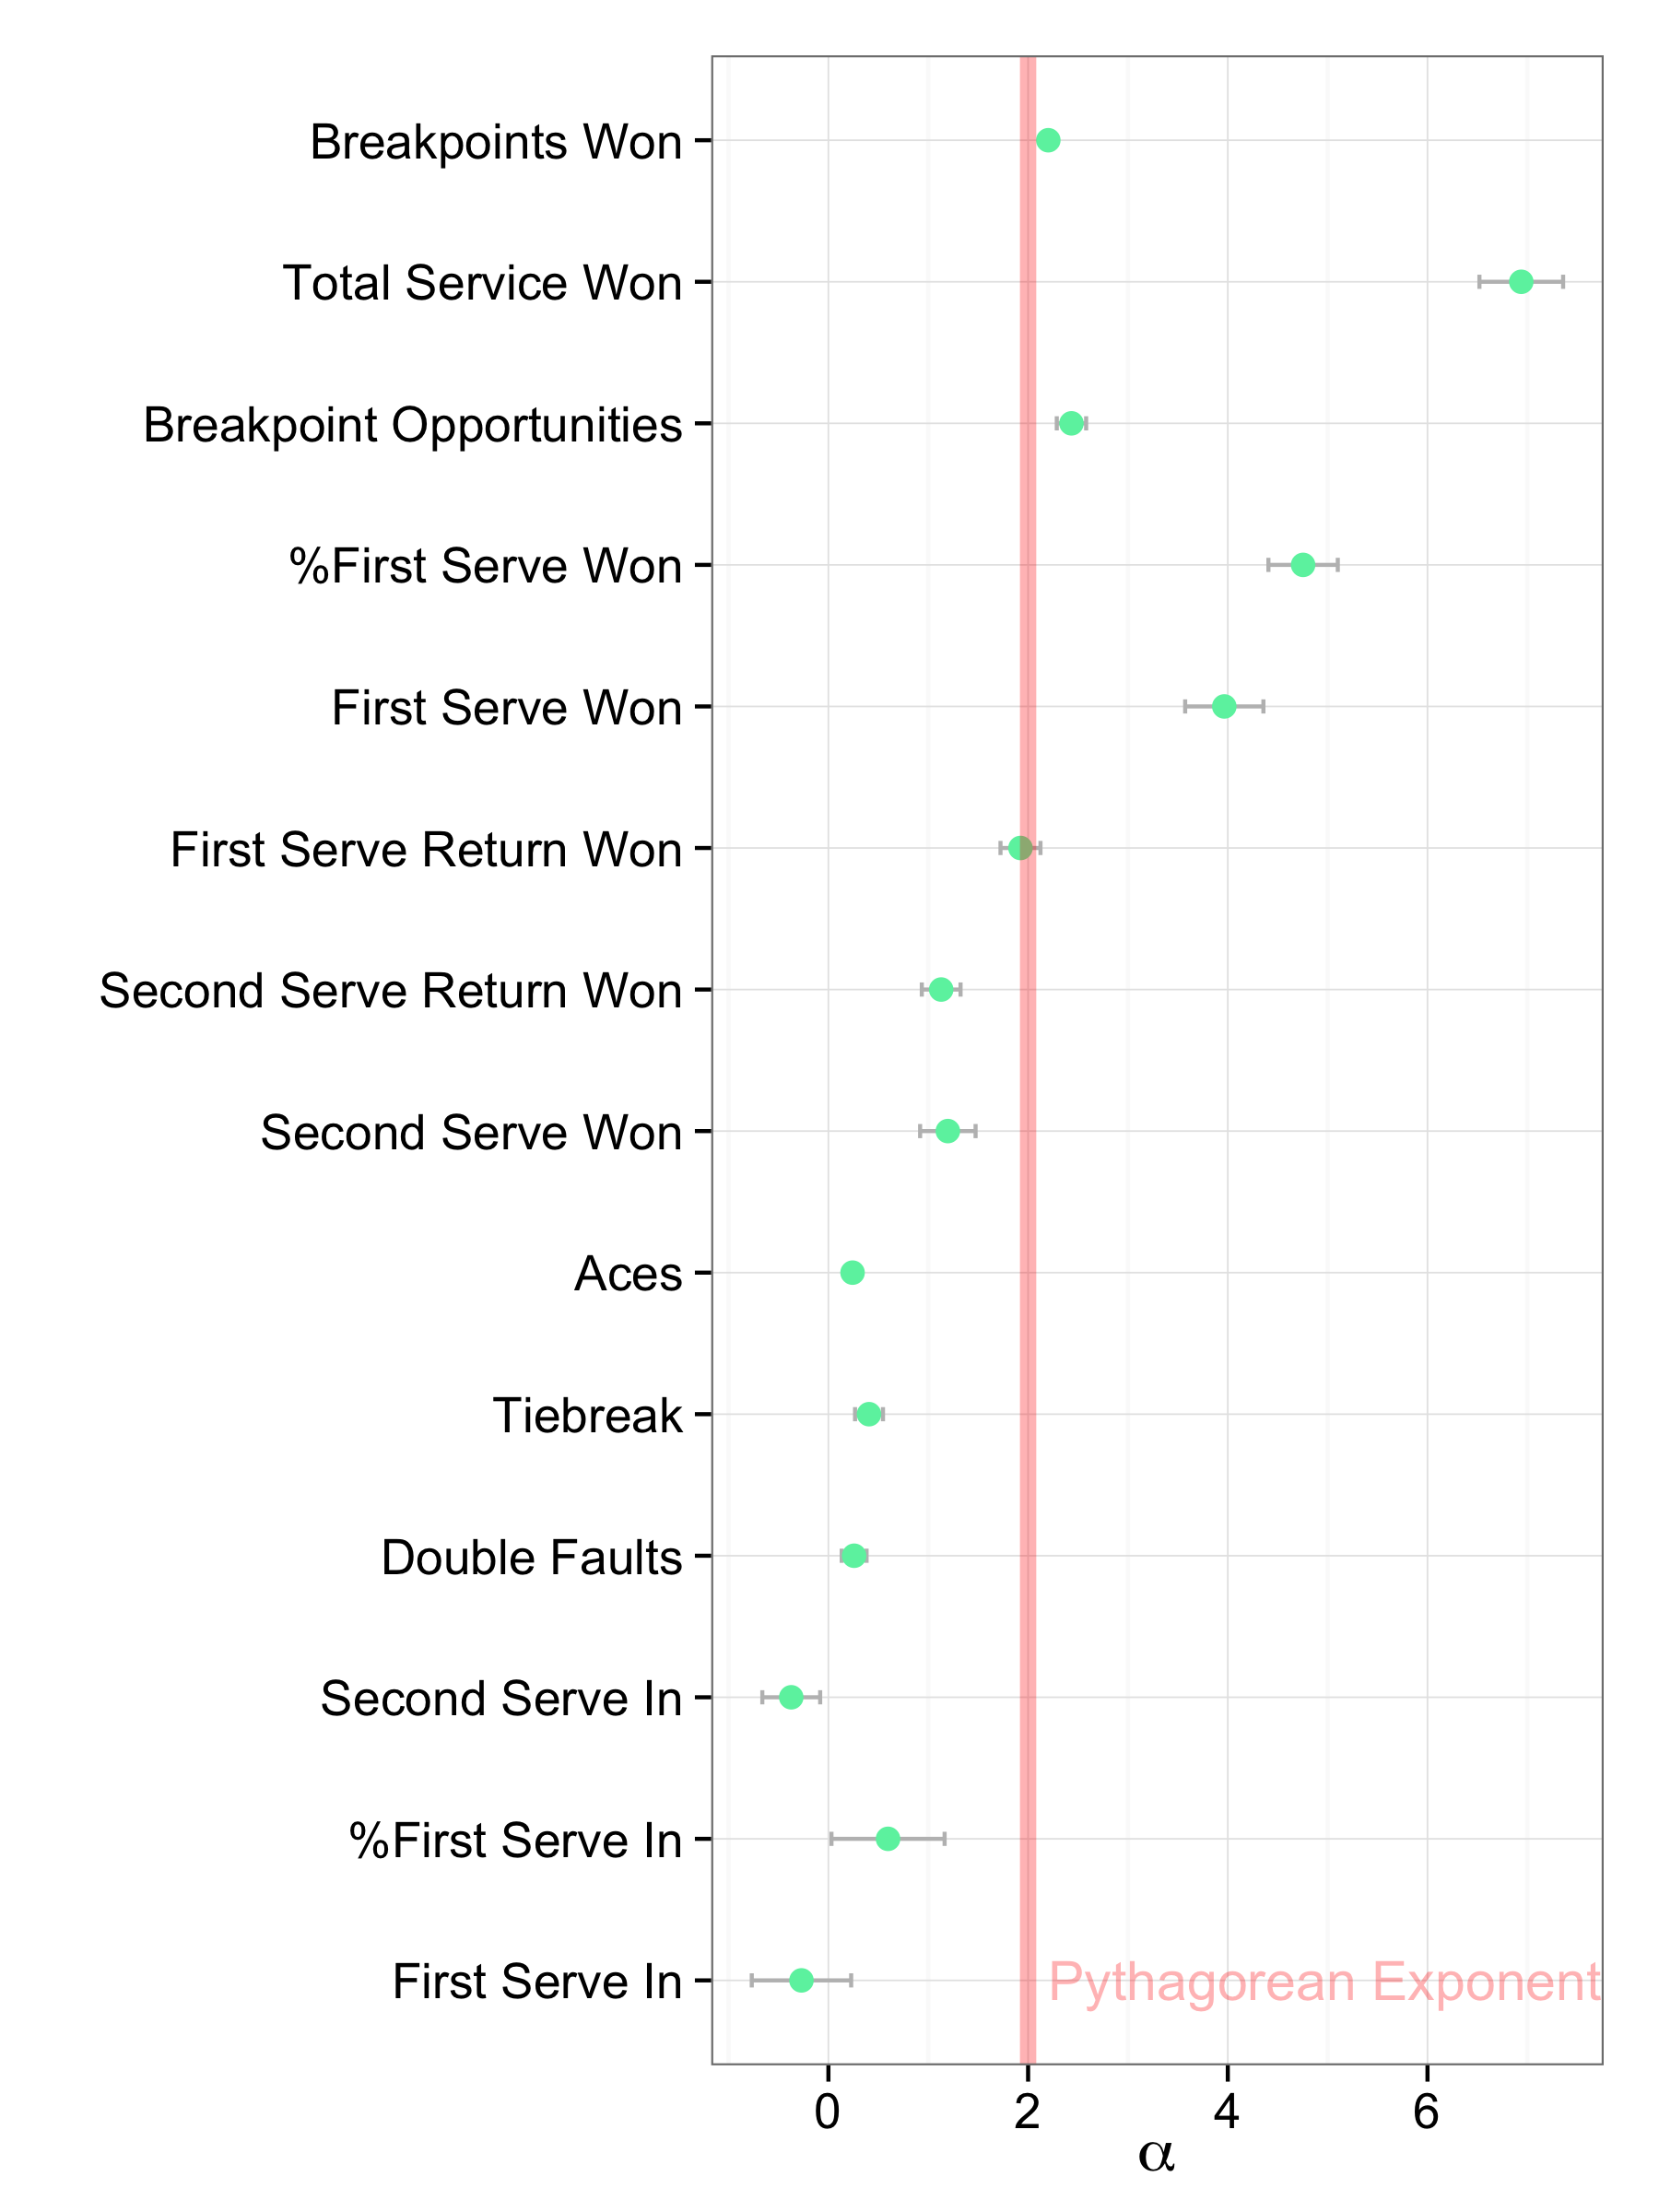
Figure 1 shows the exponents for each performance measure based on 2010 - 2015 match win outcomes for the WTA. First serve won had an estimate of $\alpha = 4.75$. So, going back to the example above, the estimate for 2010 season wins for Na based on points won on first serve was
$$ Win% = 1105^4.75/(1105^4.75 + 949^4.75); x; 100 = 67% $$
Her actual win percentage out of the 45 matches included in the analysis was 64%.
In the $BP^2$ model for the men’s tour, the best-fitting exponent was 1.83, very close to the Pythagorean exponent of 2. For the WTA, the breakpoint model’s best-fitting coefficient is 2.28, also close to a Pythagorean relationship but in the opposite direction as the men’s tour. This suggests that an equal improvement in breakpoint conversion over opponents on the women’s tour is associated with a greater increase in win percentage than for the men— suggesting that relative breakpoint strength has a somewhat stronger relationship to win outcomes than men.
But how accurately do these models predict win percentage?
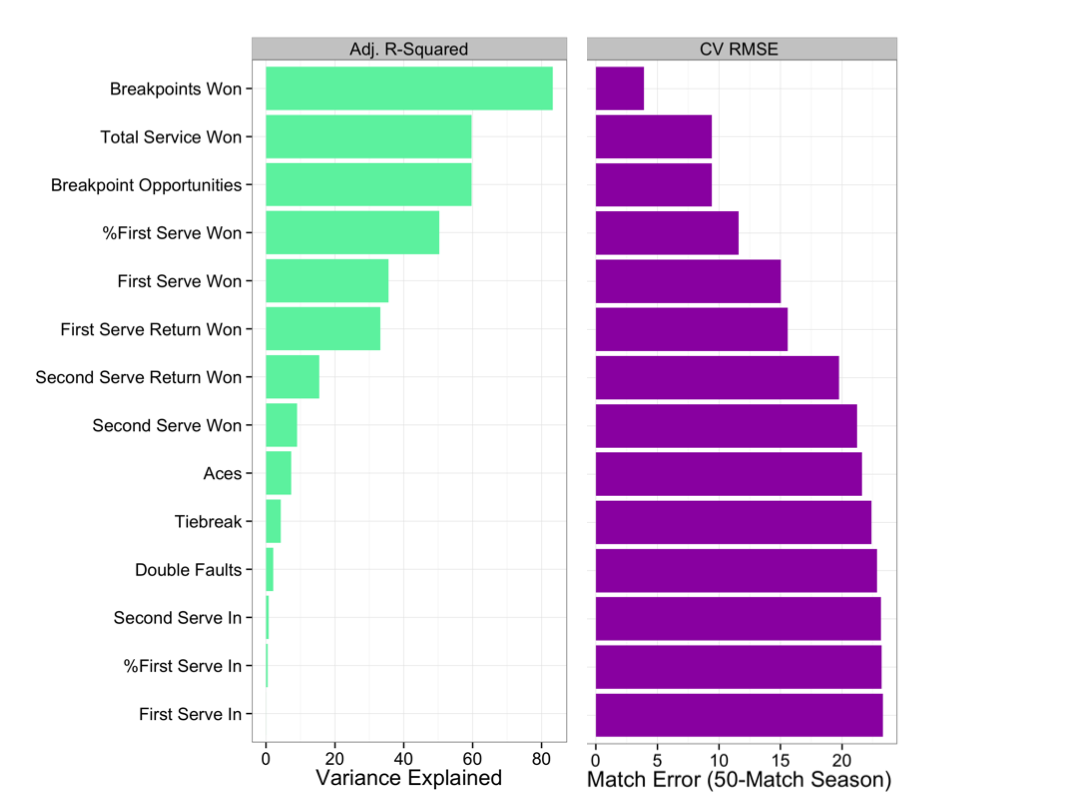
Figure 2 shows that breakpoints won is the strongest predictor of win percentage, explaining 83% of variance with an error of $\pm4$ matches in a 50-match season. This is very similar to the results for the men’s tour. Interestingly, unlike the findings for the men, the second best predictor is total serve points won (rather than breakpoint opportunities), suggesting that greater relative dominance on serve is a greater factor in win outcomes for the women’s tour than the men’s tour. This is consistent with the observation that more breaks of serve occur on the women’s tour.
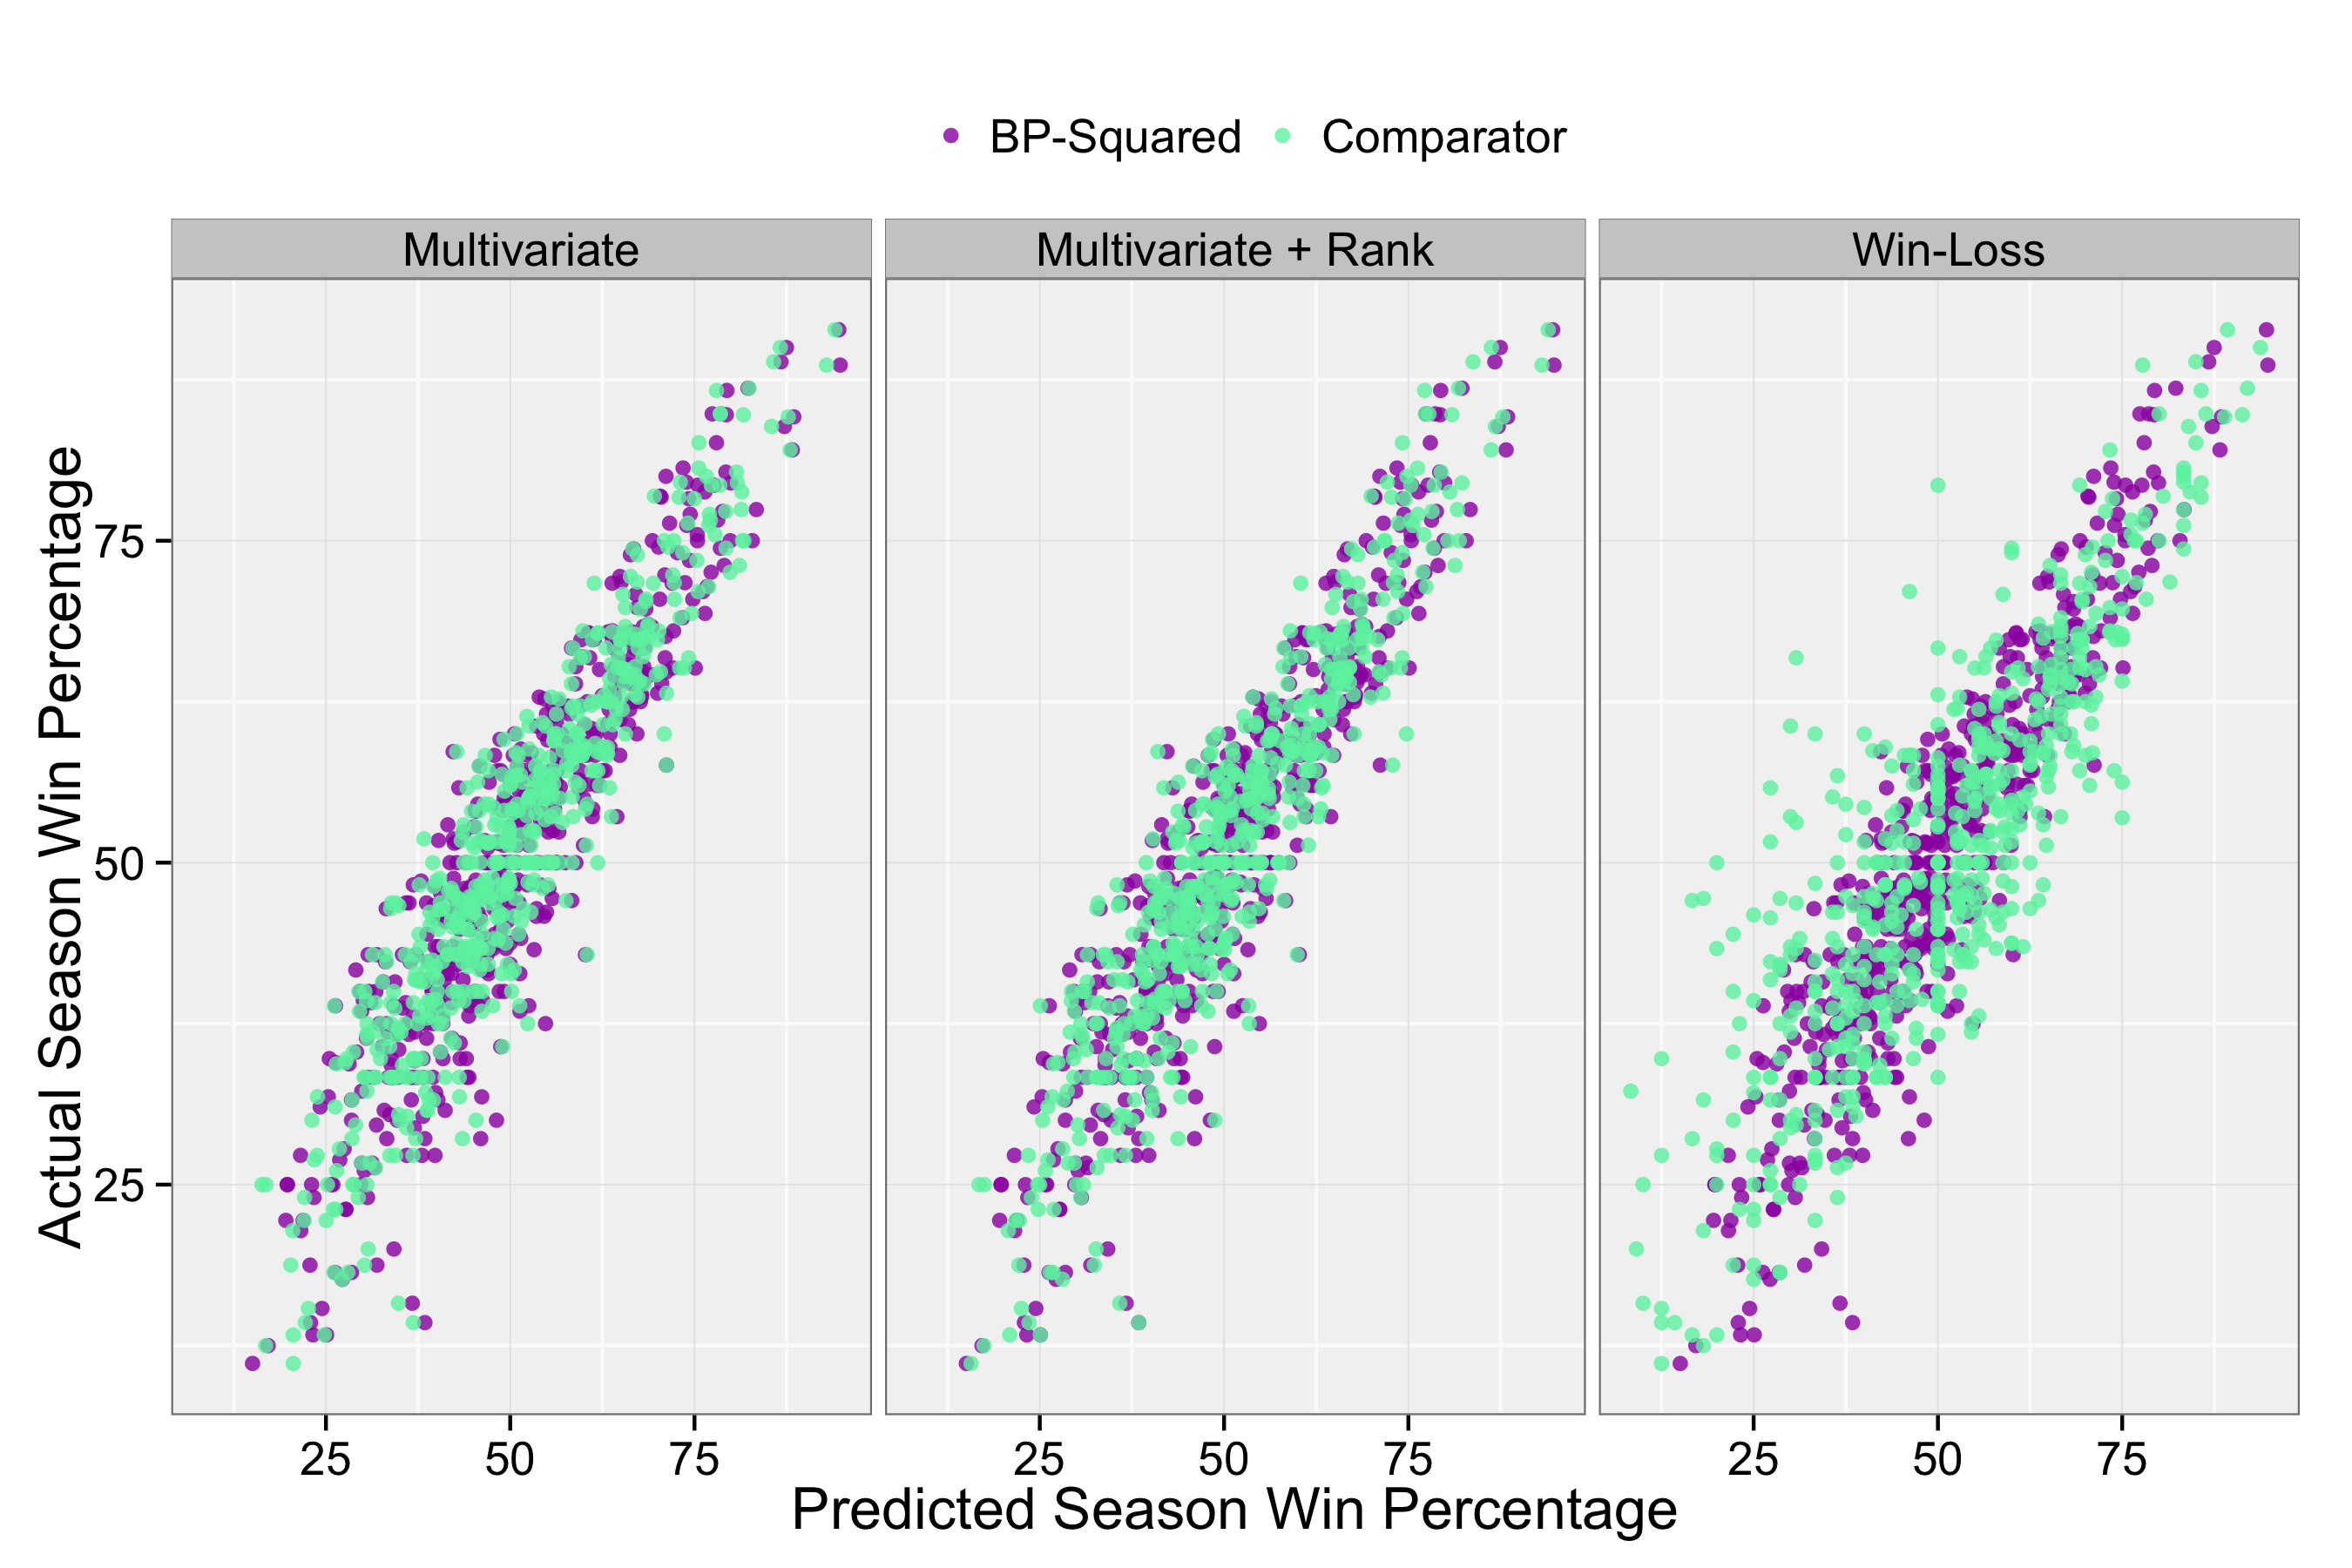
One of the most valuable uses of Pythagorean expectation in baseball is for win projection because it outperforms projections based on win-loss record. I showed that this was also true for the $BP^2$ model for men’s tennis. Figure 3 compares mid-season win projections using the $BP^2$ Pythagorean model against a regression model with the most predictive of the 14 performance measures, the same model with player-opponent relative tour rankings, and win-loss record. Looking at the panel on the far right for win-loss, we see a large scatter of points for win-loss projections, indicating that a player’s mid-season match wins could vary widely from where they were at the end of the year. In fact, the error for win-loss in a 50-match season was more than 1 match greater than the error based on $BP^2$— an error rate that was nearly identical to the performance of the multivariate models.
Thus, despite a number of difference in the structure and style of play between the men’s and women’s game, the Pythagorean relationship between breakpoints and win percentage holds up for both tours. There is even some evidence in the findings presented here to indicate that the $BP^2$ model outperforms win-loss record even better for the women’s game than the men’s. For both tours, $BP^2$ promises to be a simple and useful tool for accurately evaluating player strength.