When Two First Serves are Better Than One - Part 2
Guest blogger, Peter Tea, returns for another chapter of the conundrum that is Alexander Zverev’s serve. In this second part of the When Two First Serves are Better Than One series, Tea investigates the trends behind Zverev’s serve and attempts to identify the specific factors that have made him a surprising candidate for a two-first-serve strategy.
You would be hard pressed to find a top 10 player in recent memory with a more vexing 2nd serve than Zverev. In 2019, Zverev’s season was mired by double faults, a season in which 1 in every 5 of his 2nd serves ended in a double fault on average. And around that mean were some epic meltdowns. Most notable was Zverev’s Cincinnati Open match loss against 59th ranked Kecmanovic where he hit a career high 20 double faults, a stat leaderboard that no player wants to be at the top of.
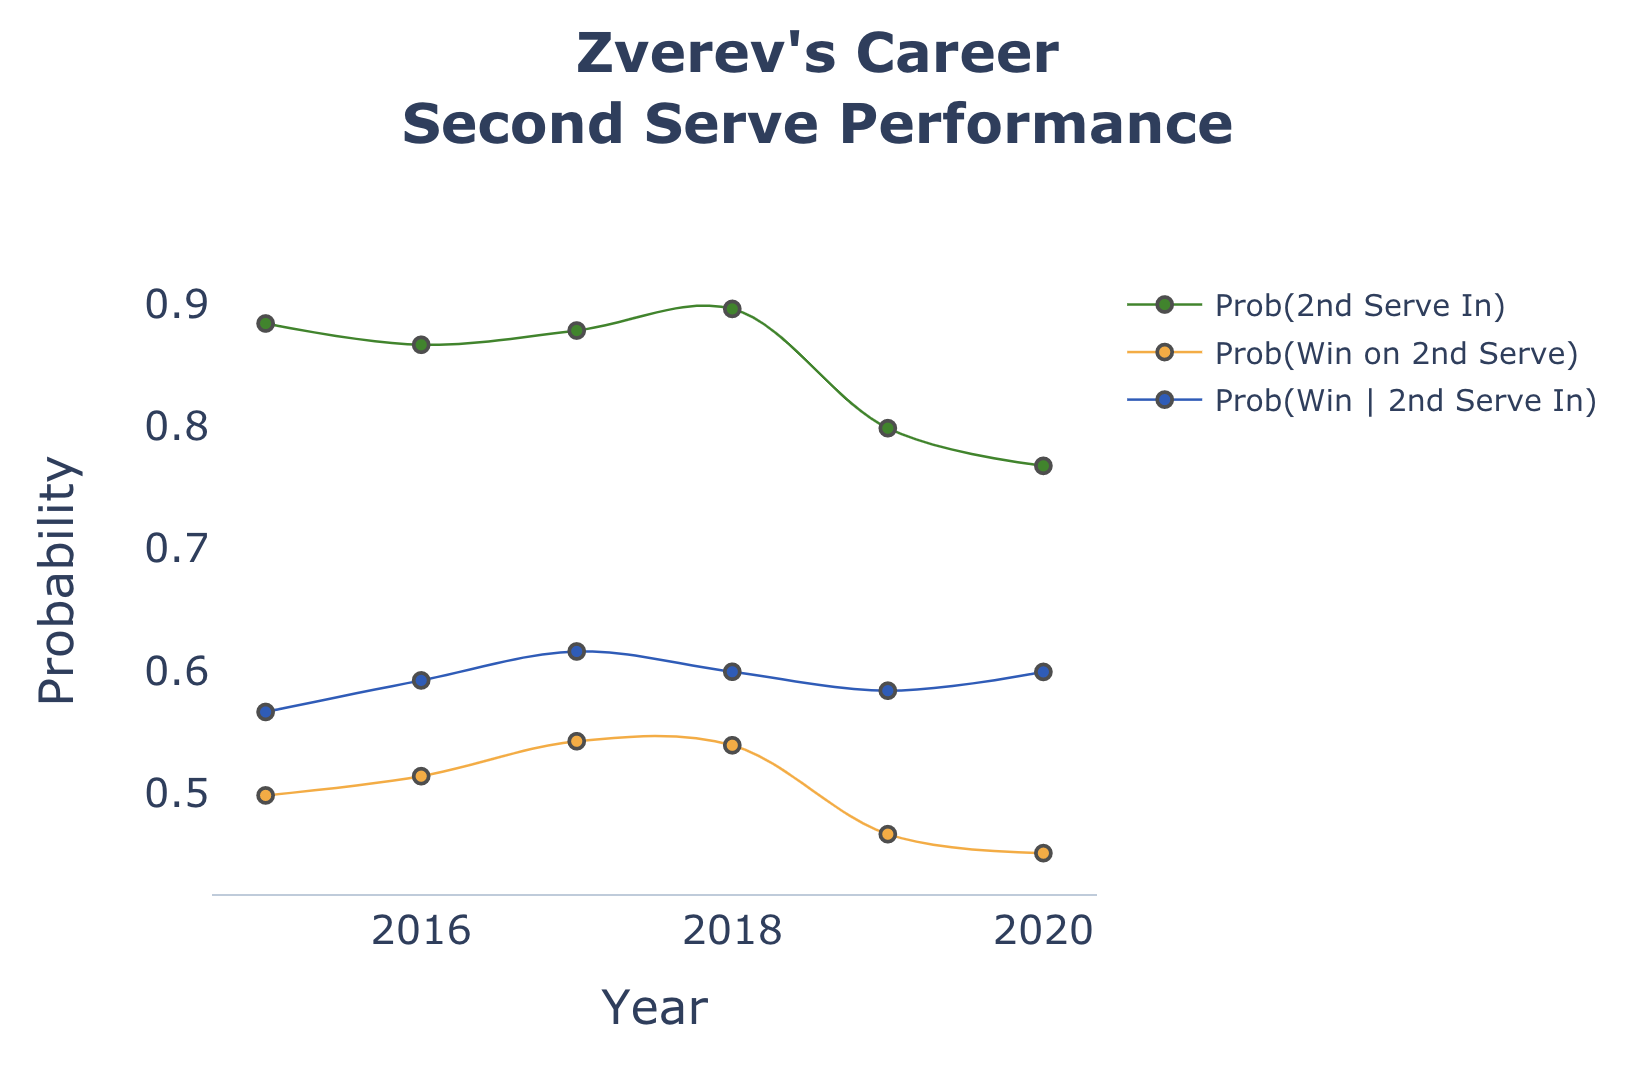
The story gets even more interesting when we look back at Zverev’s 2nd serve performance and it was once quite good. Between 2015 and 2018, Zverev percentage of 2nd serve points hovered around an average of 90% and he was winning 60% or more of points on good 2nd serves for most of those years (Fig. 1). But 2019 saw a dramatic decline in his 2nd serve accuracy, which caused a nosedive in his overall effectiveness.
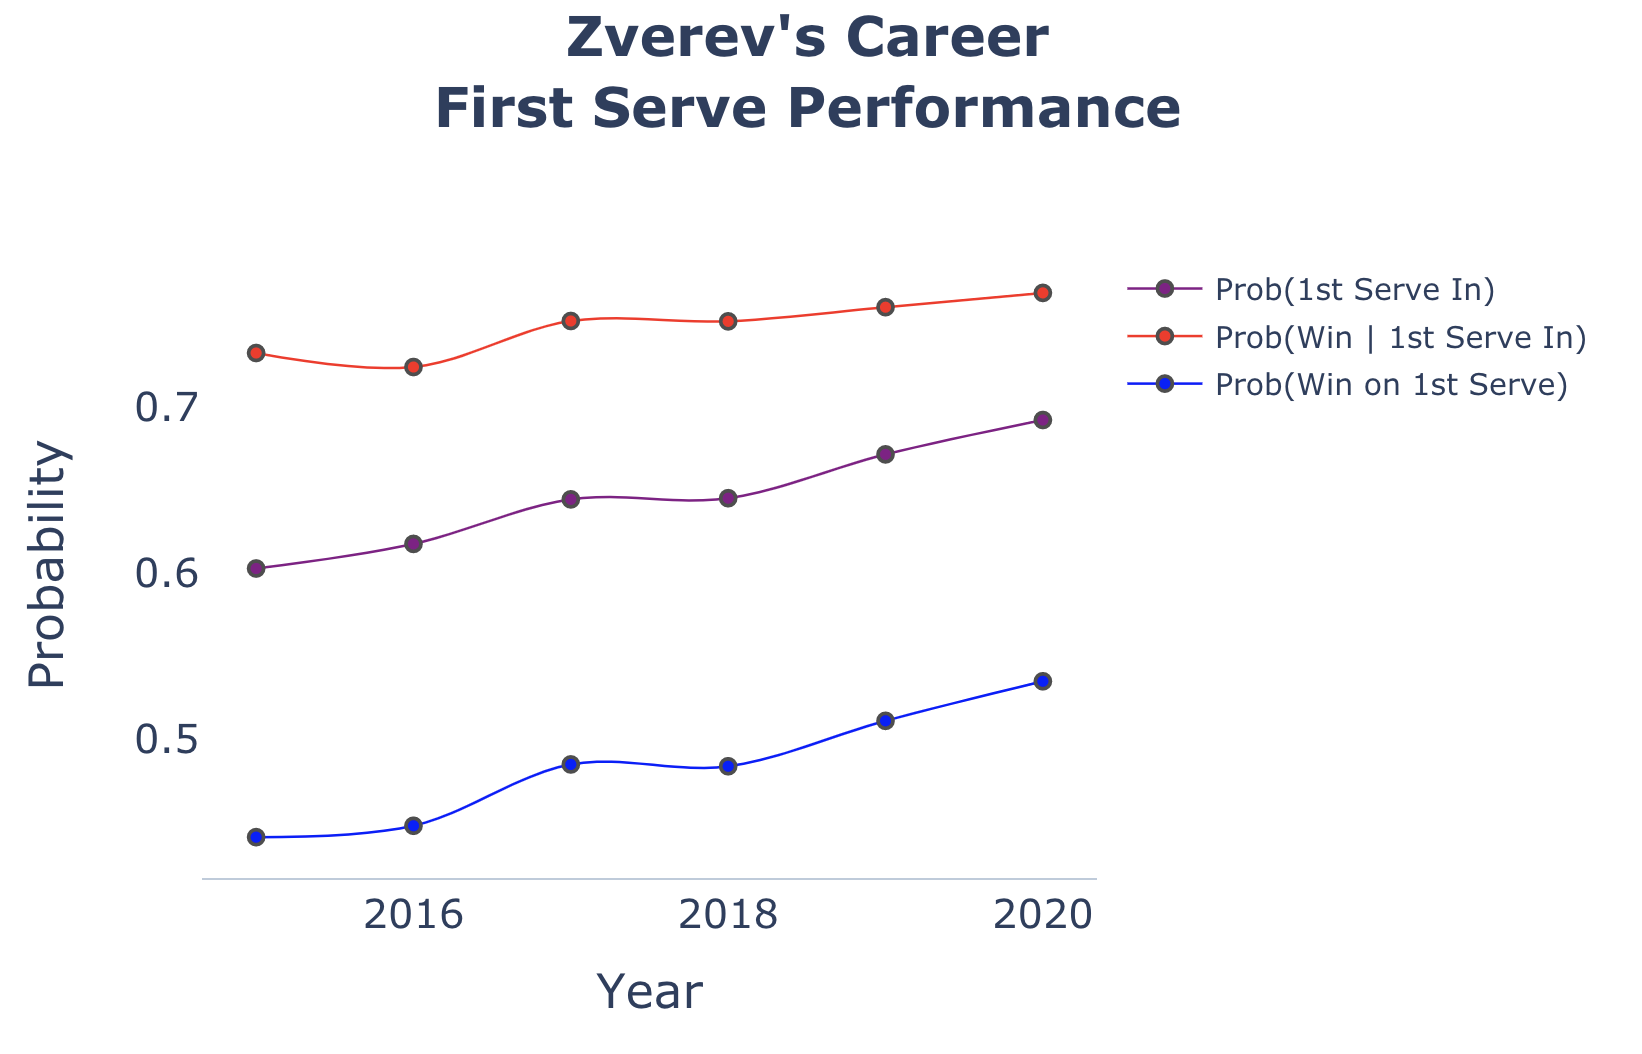
While trends in Zverev’s 2nd serve have been distressing, it is a completely different story on his 1st serve (Fig. 2). In 2019, Zverev set career highs in $Prob(\mbox{1st Serve In})$ and $Prob(\mbox{Win on 1st Serve})$. What’s more, his 1st serve has shown an impressively consistent improvement since stepping onto the tour. The evolution of Zverev’s serves is the tennis equivalent to a split personality.
Zooming more closely into this timeframe, we can look at the match-by-match trajectory of Zverev’s 2nd serve accuracy and get a better glimpse at when these 2nd serve struggles may have manifested.
At the beginning of 2018, Zverev had demonstrated remarkable 2nd serve accuracy. This stretch featured an impressive showing at the 2018 Madrid Open (highlighted in red on Fig. 3) where Zverev played out of his mind. En route to the championship, Zverev won 5 matches - all in straight sets, which included bouts against Isner (QF), Shapovalov (SF) and Thiem (F). Perhaps a more impressive feat was the dominant way Zverev won these matches: only one recorded double fault (against Shapovalov) and a single break point faced in the 3rd round (which he later saved). An exemplary performance for any tennis player, this run can easily remind us of Zverev’s special potential.
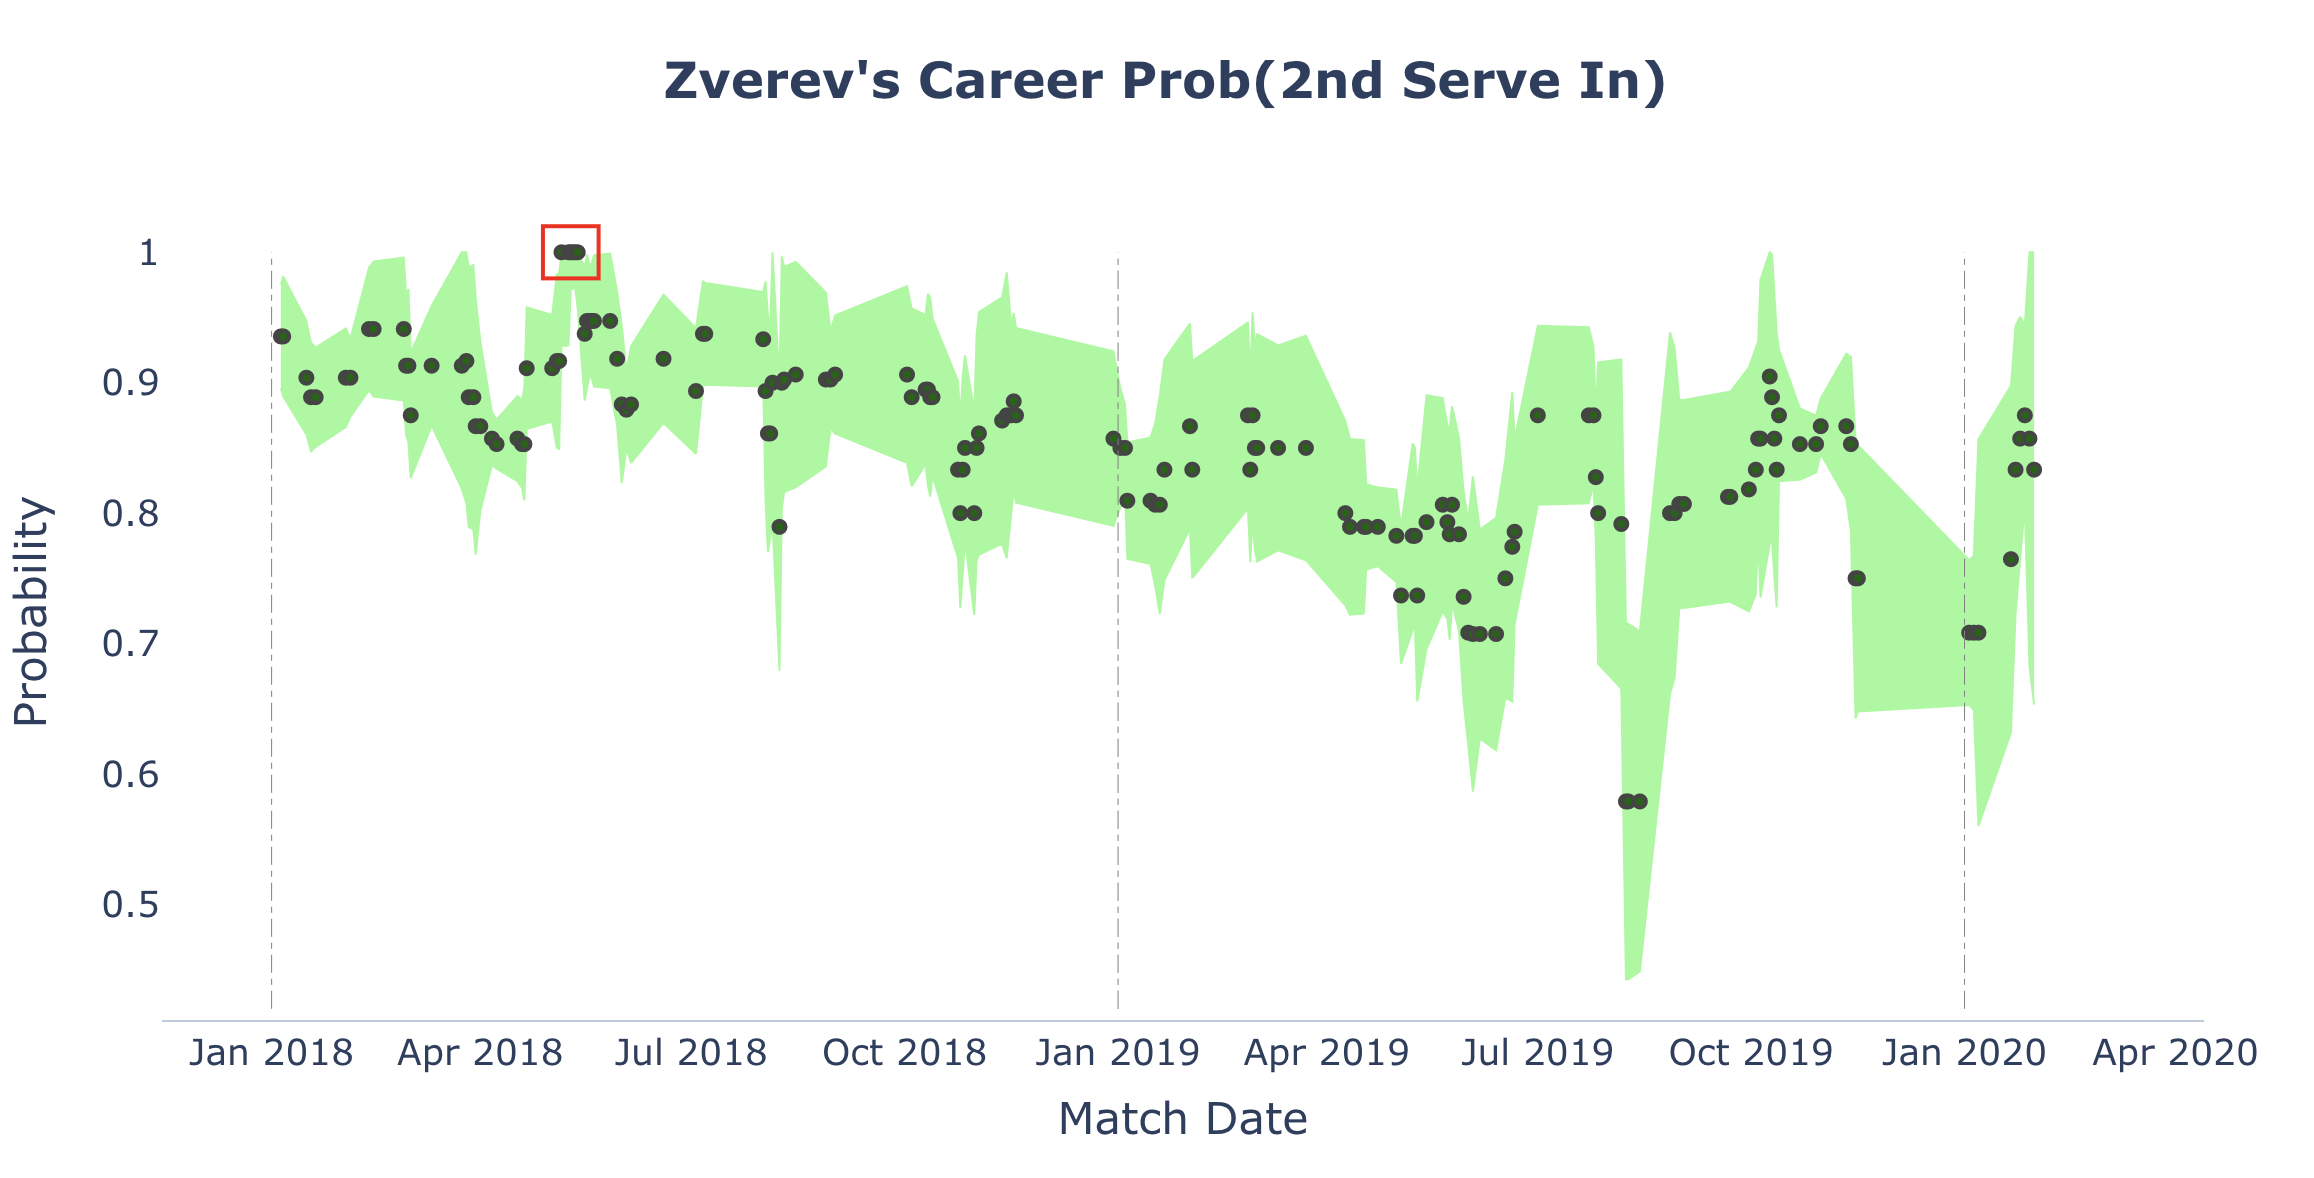
Unfortunately, his exceptional 2nd serve accuracy would not be sustained. From August 2018 onwards, cracks began emerging in Zverev’s 2nd serve accuracy. By 2019, these cracks ultimately fissured into a worrisome declining slope including multiple $Prob(\mbox{2nd Serve In})$ performances below 60% (matches at the Rogers Cup and Cincinnati Open).
Although we can never how 2020 would have compared if it had not been disrupted by the COVID-19 pandemic, Zverev’s performances at the ATP Cup and Mexican Open in Acapulco painted a familiar, turbulent 2nd serve. In the aggregate of 11 recorded matches in 2020 (not including the recent Adria Tour debacle), Zverev was averaging a subpar 1 double fault per 4 second serve attempts while the remaining ATP field was averaging about 1 double fault per 10 second serve attempts (a rate respectably synonymous with Zverev’s isolated 2020 Australian Open run).
On a positive note his 1st serve performance, especially in $Prob(\mbox{1st Serve In})$, continues to rise which allows Zverev to more comfortably and confidently play a higher level of tennis on his 1st serve, rather than being exploited on his shakier 2nd serve. However, on a more cautionary note Zverev’s continual increase in $Prob(\mbox{1st Serve In})$ might eventually lead to a limited - or even reduced - return value in his $Prob(\mbox{Win | 1st Serve In})$. A serve likely becomes more predictable as a by-product of its efficiency and, like a seesaw, as one goes up the other eventually comes down. So, while Zverev has been steadily increasing in both 1st serve categories, he is likely to plateau in his overall 1st serve performance.
What’s up with Zverev’s serve?
Given the clear gap between Zverev’s 1st and 2nd serve, a natural follow-up is to probe what may be underlying his serve trends.
If the loss in accuracy in Zverev’s serve is due to technique, we might expect to see the loss in accuracy in all game situations. We consider the current score on serve to explore different game situations according to their pressure. All of the data that follows is based on play-by-play data for grand slam matches provided by Jeff Sackmann’s github repos. Before moving to the analysis, we should note that the grand slams represent only a subset of matches played in a year. While they provide some useful information, they are not necessarily a representative sample of Zverev’s entire body of work. For example, in 2019 the grand slams only accounted for 20% of his matches played that season.
To assess serve risk tolerance on different pressure score situations, we compared Zverev’s rate of double faults to his rate of aces hit. Inherently, taking more risk on serve should increase both the rate of double faults and aces, while taking less risk should reduce these serve rates.
To simplify our comparisons, we amalgamated scores into 6 groups demarcated based on their impact and contextual meaning. The groupings, inspired by Tennis Analytics, are as follows:
-
Break Point: Score where Zverev is on brink of having serve broken. Ex: 40 - AD, 30 - 40, 4 - 6, etc
-
Game Point: Score where Zverev has the opportunity to serve for the game. Ex: AD - 40, 40 -0, 6-4, etc
-
First Point: First serve of each game
-
Behind: Score where Zverev is trailing, but not including break points. Ex: 0 - 15, 15 - 30, 2 - 4, etc
-
Ahead: Score where Zverev is leading, but not including game points. Ex: 15 - 0, 30 - 15, 4 - 2, etc
-
Even: Tied score, but not including first points. Ex: 15 - 15, 30 - 30, 3 - 3, etc
With this grouping scheme, we don’t necessarily get equal sample sizes across groups. For example, in 2019 Zverev had faced only 150 grand slam break points compared to a relatively larger 422 ahead points. The notion of a sufficient sample size is not clear, however we present our cautious note for transparency of our chosen methodology.
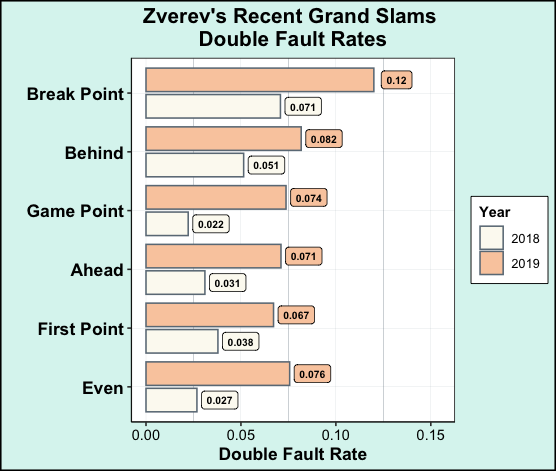
Consistently, Zverev’s double fault rate increased across all 6 categories from 2018 compared to 2019. Interestingly, his highest double fault rate of 0.12 occurred on breakpoints: about 1 double fault for every 8 break point serve attempts, which automatically conceded the service game to his opponent. What’s more, Zverev also had a relatively large increase in his double fault rate when facing game point.
An increase in double fault rates suggests that Zverev was systematically choosing more risk on his serve. Do we see the same on the first? Interestingly, what we observe is that his ace rates did not resoundingly increase across all 6 categories, as we saw previously for his double fault rates. For example, on break point we see only a modest increase from 0.062 to 0.073 in the rate of aces hit. Really, it is only in the ahead and even points where we see clear increases in the rate of aces hit.
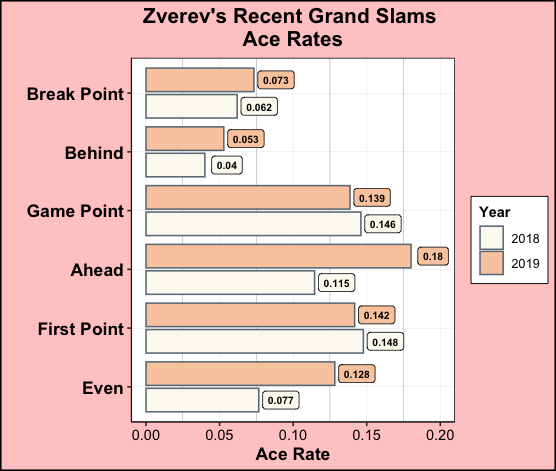
In summary, when Zverev is ahead or at least even in the service game, there is a reasonable tendency to take more risks on serve and hit a higher rate of aces. But when he’s behind, and especially when on the verge of being broken, Zverev takes considerably much less risk as evident with his relatively lower ace rate. Also, during these high-pressure scores if he faults and is boxed into his second serve, then he has a dangerously high risk of double faulting.
The broad increase in risk on the second serve along side the selective risk on first is all suggestive of a biomechanical or mental change on the 2nd serve rather than a conscious change in his risk strategy.
Serve Speeds
Simply looking at rates of double faults or aces is somewhat limited as it does not directly describe the intention behind Zverev’s serves. To investigate Zverev’s serve process rather than his mere serve outcomes, we shift our focus now onto serve speeds. We looked only at the Australian Open (AO) campaign to limit tournament-specific speed measurement bias and because the AO provided the cleanest serve speed data among the grand slam tournaments.
At first glance, Zverev’s speed distribution on 1st serve is consistently much faster than that on 2nd serve. His average 1st serve speed at the AO increased from 202 KM/H to 206 KM/H in 2018 to 2019, respectively: by contrast his average 2nd serve speed remained stagnant at an average of 167 KM/H. Unsurprisingly, most of his aces hit came off of his electric 1st serve.
Combining serve speed with score situation, we found that his 2nd serve speed was particularly slow when behind in the service game and especially when facing break point.
This finding is likely not unique to Zverev, as break points are arguably the most uncomfortable points to serve free-flowingly in a match - particularly on 2nd serve. Nonetheless, it does corroborate our previous proposition that Zverev did not have much of an appetite for extra serve risk when falling behind in the service game. These visual findings are also consistent across the other 3 grand slams, which you can view here.
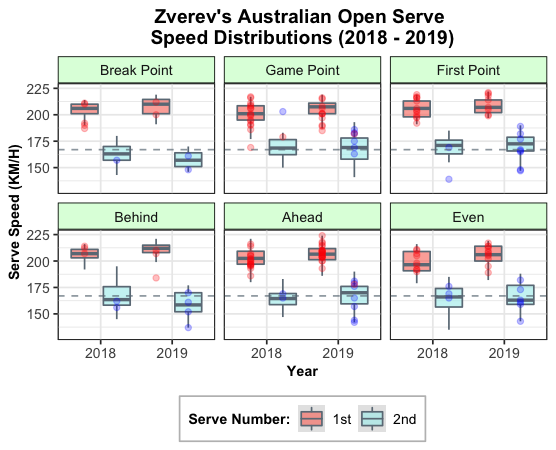
On a final note about serve speeds, we also looked at speeds where Zverev recorded aces (red dots) and double faults (blue dots). Our initial hypothesis was that if extremely high or low serve speeds by nature represent a deviation from the norm, then these outlying speeds may be more susceptible to an ace or double fault. But what we observe is that most ace and double fault speeds do not stray too far away from the center of each plotted distribution. Other factors, such as returner position and skill may more strongly influence these serve outcomes than mere serve speed in isolation.
Since 2019, Zverev’s 2nd serve has been a conundrum. What’s astounding is that despite having a tanking 2nd serve, Zverev was still able to consistently maintain a top 7 ATP ranking and hasn’t fallen out of this position since mid 2017. At age 23 there is of course still plenty of time to grow, and he will no doubt have plenty of time for self-reflection after the failed Adria Tour. Wiser decisions and an overhaul of his second serve could all be in order if Zverev is ever to reach his peak potential.