How to Best Quantify Service Pressure
Pressure is one of those concepts in tennis that we all know exists but we struggle to calculate. I’ve made multiple attempts at quantifying scoreboard pressure and have yet to come around to one that is both statistically useful and easy to interpret. But some recent experimenting has uncovered what I think could be as close to a ‘best’ statistic for pressure as I am likely to find.
The topic of pressure is always present in tennis. With every tournament we inevitably ask who has faced the most pressure? And who is handling pressure the best?
Pressure was one of the more interesting talking points going into the men’s and women’s finals at the Australian Open last week owing to a coincidental parallel in the journeys of the men’s and women’s finalists. Both Naomi Osaka and Novak Djokovic went into the finals with the better ranking position than their opponents and the 2018 US Open titles at the top of their CVs. But they had also had the harder time in reaching the finals, at least, in terms of sets. Djokovic lost two sets on his way to the final; Osaka lost three.
Their opponents, Petra Kvitova and Rafael Nadal, on the other hand, had looked flawless up until the final. Neither player dropping a set over 6 matches.
Before either final was played, commentators, like ancient Peripatetics, were debating whether it was a better advantage to have dominated strongly before the final or to have been faced with adversity on the way there? Now that we know how the finals played out it is difficult to weigh those alternatives without the bias of hindsight.
But the purpose of this post isn’t to settle the question of how much pressure is good preparation for the finalist of a Major. It is to look at how to go about measuring pressure in the first place.
To start, I am going to focus on the pressure experienced by the server. I don’t think to much is lost by starting here considering that, especially in the men’s game, the server is expected to win the majority of points. For this reason, expectations about the outcomes of points rest largely on the server’s shoulders.
The most common way tennis has traditionally quantified the pressure experienced by the server in terms of break points faced. This count (I wince at calling it a stat) has the advantage of being simple to understand: it is the number of times a server could have lost a service game based on the outcome of a single point.
But, if we want a measure that reflects the scoreboard pressure a server likely experienced, break points don’t cut it. One reason why is that a simple count of break points faced gives the same weight to all break points, as if all break points carried the same pressure. But if we compare the situation of facing break point when already a break down versus facing the first break of service at 5-5 in the deciding set of the match, we can see that break points are on a pressure continuum.
And then there are all of the other high-pressure situations outside of break points that get ignored by the simple break point count. Tiebreak points, deuce and 30-30 points, just to list a few. And depending on the set and game context these points occur, they can be expected to put greater pressure on the server than a number of break point situations.
Despite these negatives, break points have endured as the primary yardstick for gauging experienced pressure. And as much as that irks the stats heads among us, the longevity is telling us something. Namely, that, for a a stat to be taken up more broadly, interpretability is as important as having nice statistical properties.
Which all got me thinking. Suppose you had a solid way of quantifying total pressure. If you could express that in units of break points, could you not have the best of both worlds?
Point Pressure
Lets first address the hurdle of total pressure. As the name suggests, this should be a kind of sum that considers the pressure over all service points played. There is actually already a lot of groundwork here thanks to Carl Morris' idea of point importance. You can find that definition here.
I assign a pressure score to every point using a slight twist of Morris' importance. Essentially I focus on potential loss, the idea being that we, the weak human creatures we are, are more averse to losses than we are attracted to equal gains. This gives the loss-aversive form of pressure:
$$ Pressure(score) = Win(score) - Win(score - 1) $$
In the loose notation above $Win(score)$ is the conditional probability of winning the match from the current score. The $score -1$ refers to the score after losing the current point. So pressure is always some positive value that corresponds to how much footing a server has to lose, in absolute probability terms, based on the single outcome of a point.
Point Pressure Distribution
As you might guess, the win probability at any point in a match is influenced most directly by a player’s serve ability against their opponent, their opponent’s serve ability against them, and the score already reached in the match. We could imagine adjusting pressure for each individual player and opponent matchup, which might be the best way of getting to each player’s experienced pressure but would make for a big headache when trying to compare the pressure scores from one match to the next.
So to use an equal yardstick across matches, I will assign pressure scores according to the win expectations of a match played by two average servers of equal ability (that is, 65% win rate on serve for men; 57% for women).
If this probabilistic measure of pressure is sensible, we expect that break points should tend to have more pressure than regular points. But also that points later in a competitive match should have greater importance than points in a lopsided match. Let’s have a look at this by comparing the distribution of point pressure in some of these key situations in matches played in the 2018 tennis season.
Below we compare the pressure of regular points and break points in set-deciding games and match-deciding sets compared to other situations. The first thing to notice is that in any equivalent game or set situation, break points have a higher median pressure (the circles in the chart) and maximum pressure (lines show the minimum and maximum pressure). But there is a lot of overlap in regular points and break points, telling us that pressure can be high for servers even when not facing break points.
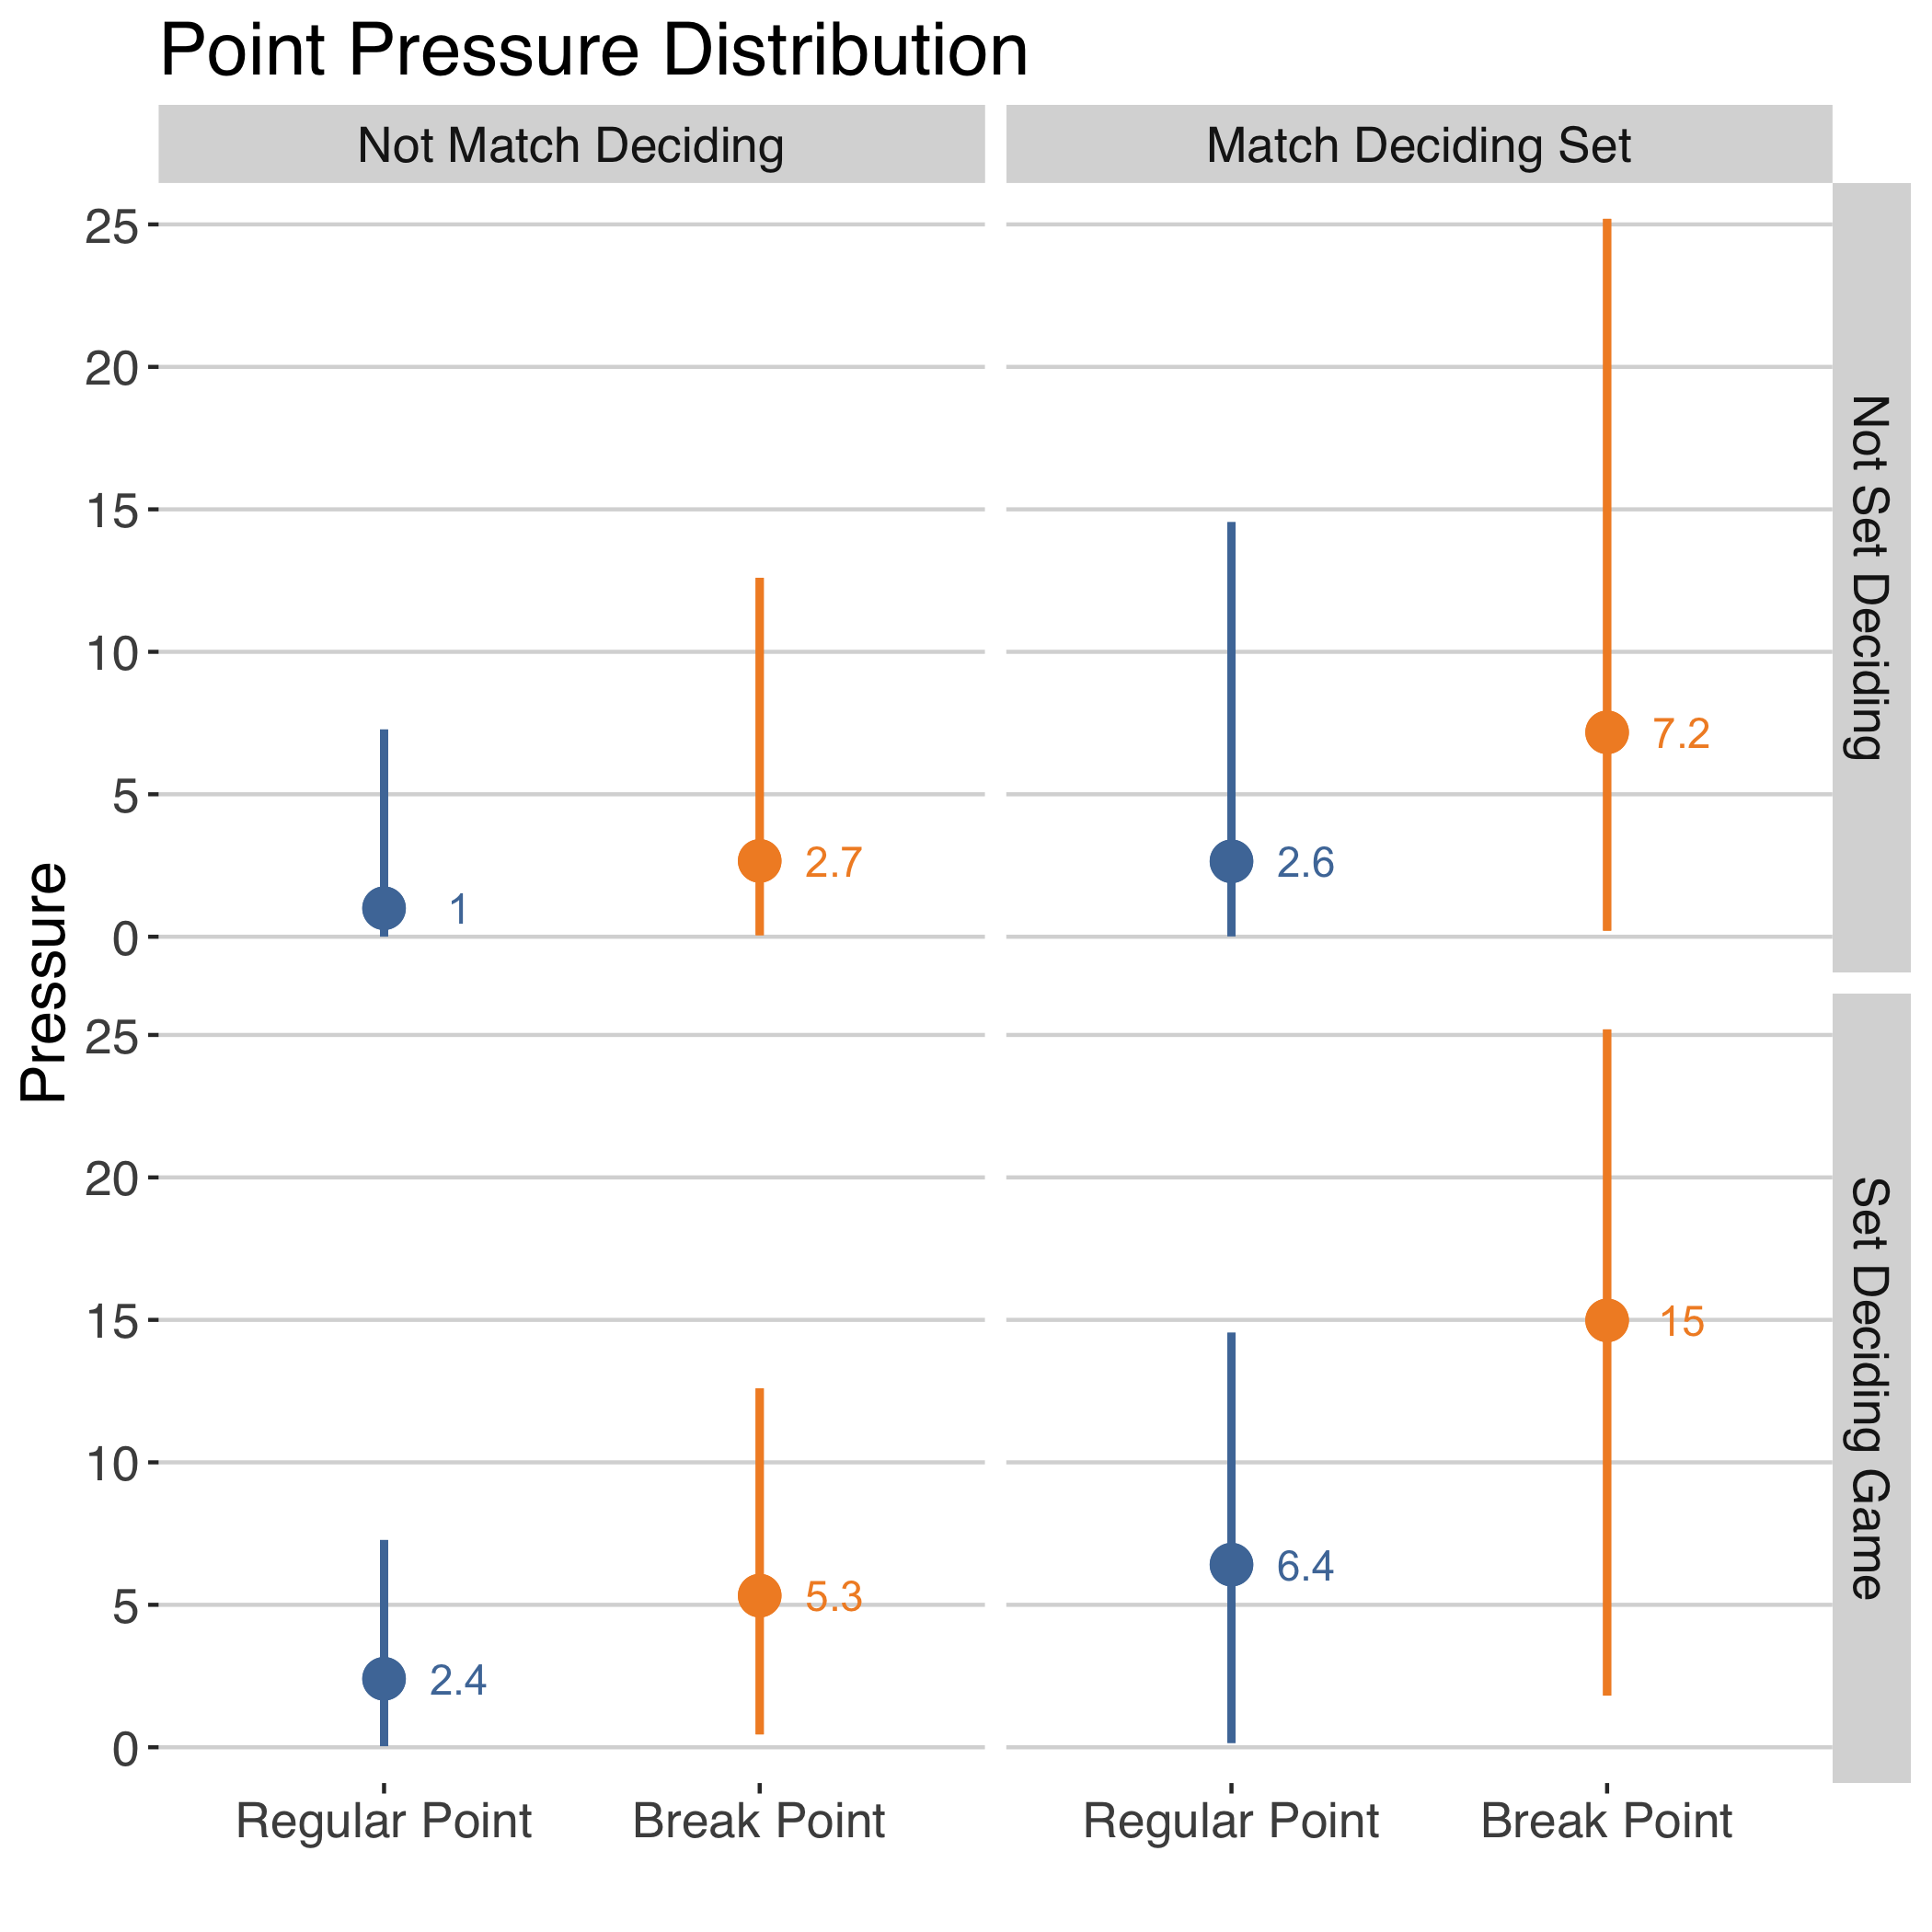
We also notice from this chart that pressure can vary a lot among break points, especially when we consider the game and set context. The median pressure among break points goes from 2.7% to 5.3% when we go from games that will not determine the set outcome to those that will. Another doubling of the median pressure happens when we consider break points in set-deciding games within a match-deciding set versus other games in match-deciding set.
The highest possible pressure of any point, not including tiebreak points, are break points in the decisive game of close sets. These are situations like facing break point at 2 sets all, serving for the 5th set, where the pressure score reaches 25%.
Note that the pressure values vary with match format (points having higher pressure with shorter formats in general). The above is based on a best of 5 format, but the same pressure trends hold when contrasting the deciding set with other sets, regardless of format.
Total Pressure
Once we can assign a pressure score to each point, we can take the sum of the pressure on service points faced in a set to measure the total service pressure of that set. Since pressure is never non-zero, a simple sum of pressure will necessarily give higher scores to sets with more service points. Is this reasonable?
Playing more points on serve can happen when more points are played in service games, when games are tight, that is, and or when more service games are played in the set. Tight games would suggest greater pressure and we might prefer to include all points in that case. But it is less clear that we should assign more pressure to sets simply because there were more service games.
The 5th set of the Anderson-Isner semifinal at the 2018 Wimbledon is a great example where total pressure might exaggerate the actual service pressure experienced. This was the match that was the last straw of the advantage final set era of Wimbledon, where 48 service games were played in the 5th set alone. But the service games were actually quite short. Anderson, in fact, never faced a single break point in the 5th despite playing 122 service points. So it was a long, draining set but not one with a great deal of pressure.
Matches like that suggest that we might want to use a truncated sum when totalling pressure. Ignoring points with pressure scores that do not reach a high enough threshold to be considered more than average pressure.
What difference would truncation make? Below is a chart of all sets played in men’s singles at the 2019 Australian Open. There are three different ways of looking at the service set pressure: 1) first with no truncation and just summing up all pressure across points on server, 2) setting points below 5% pressure, the median pressure of set-deciding break points, to zero and then taking the sum, or 3) setting points below 8% pressure, the median pressure of match-deciding break points, to zero and taking the sum.
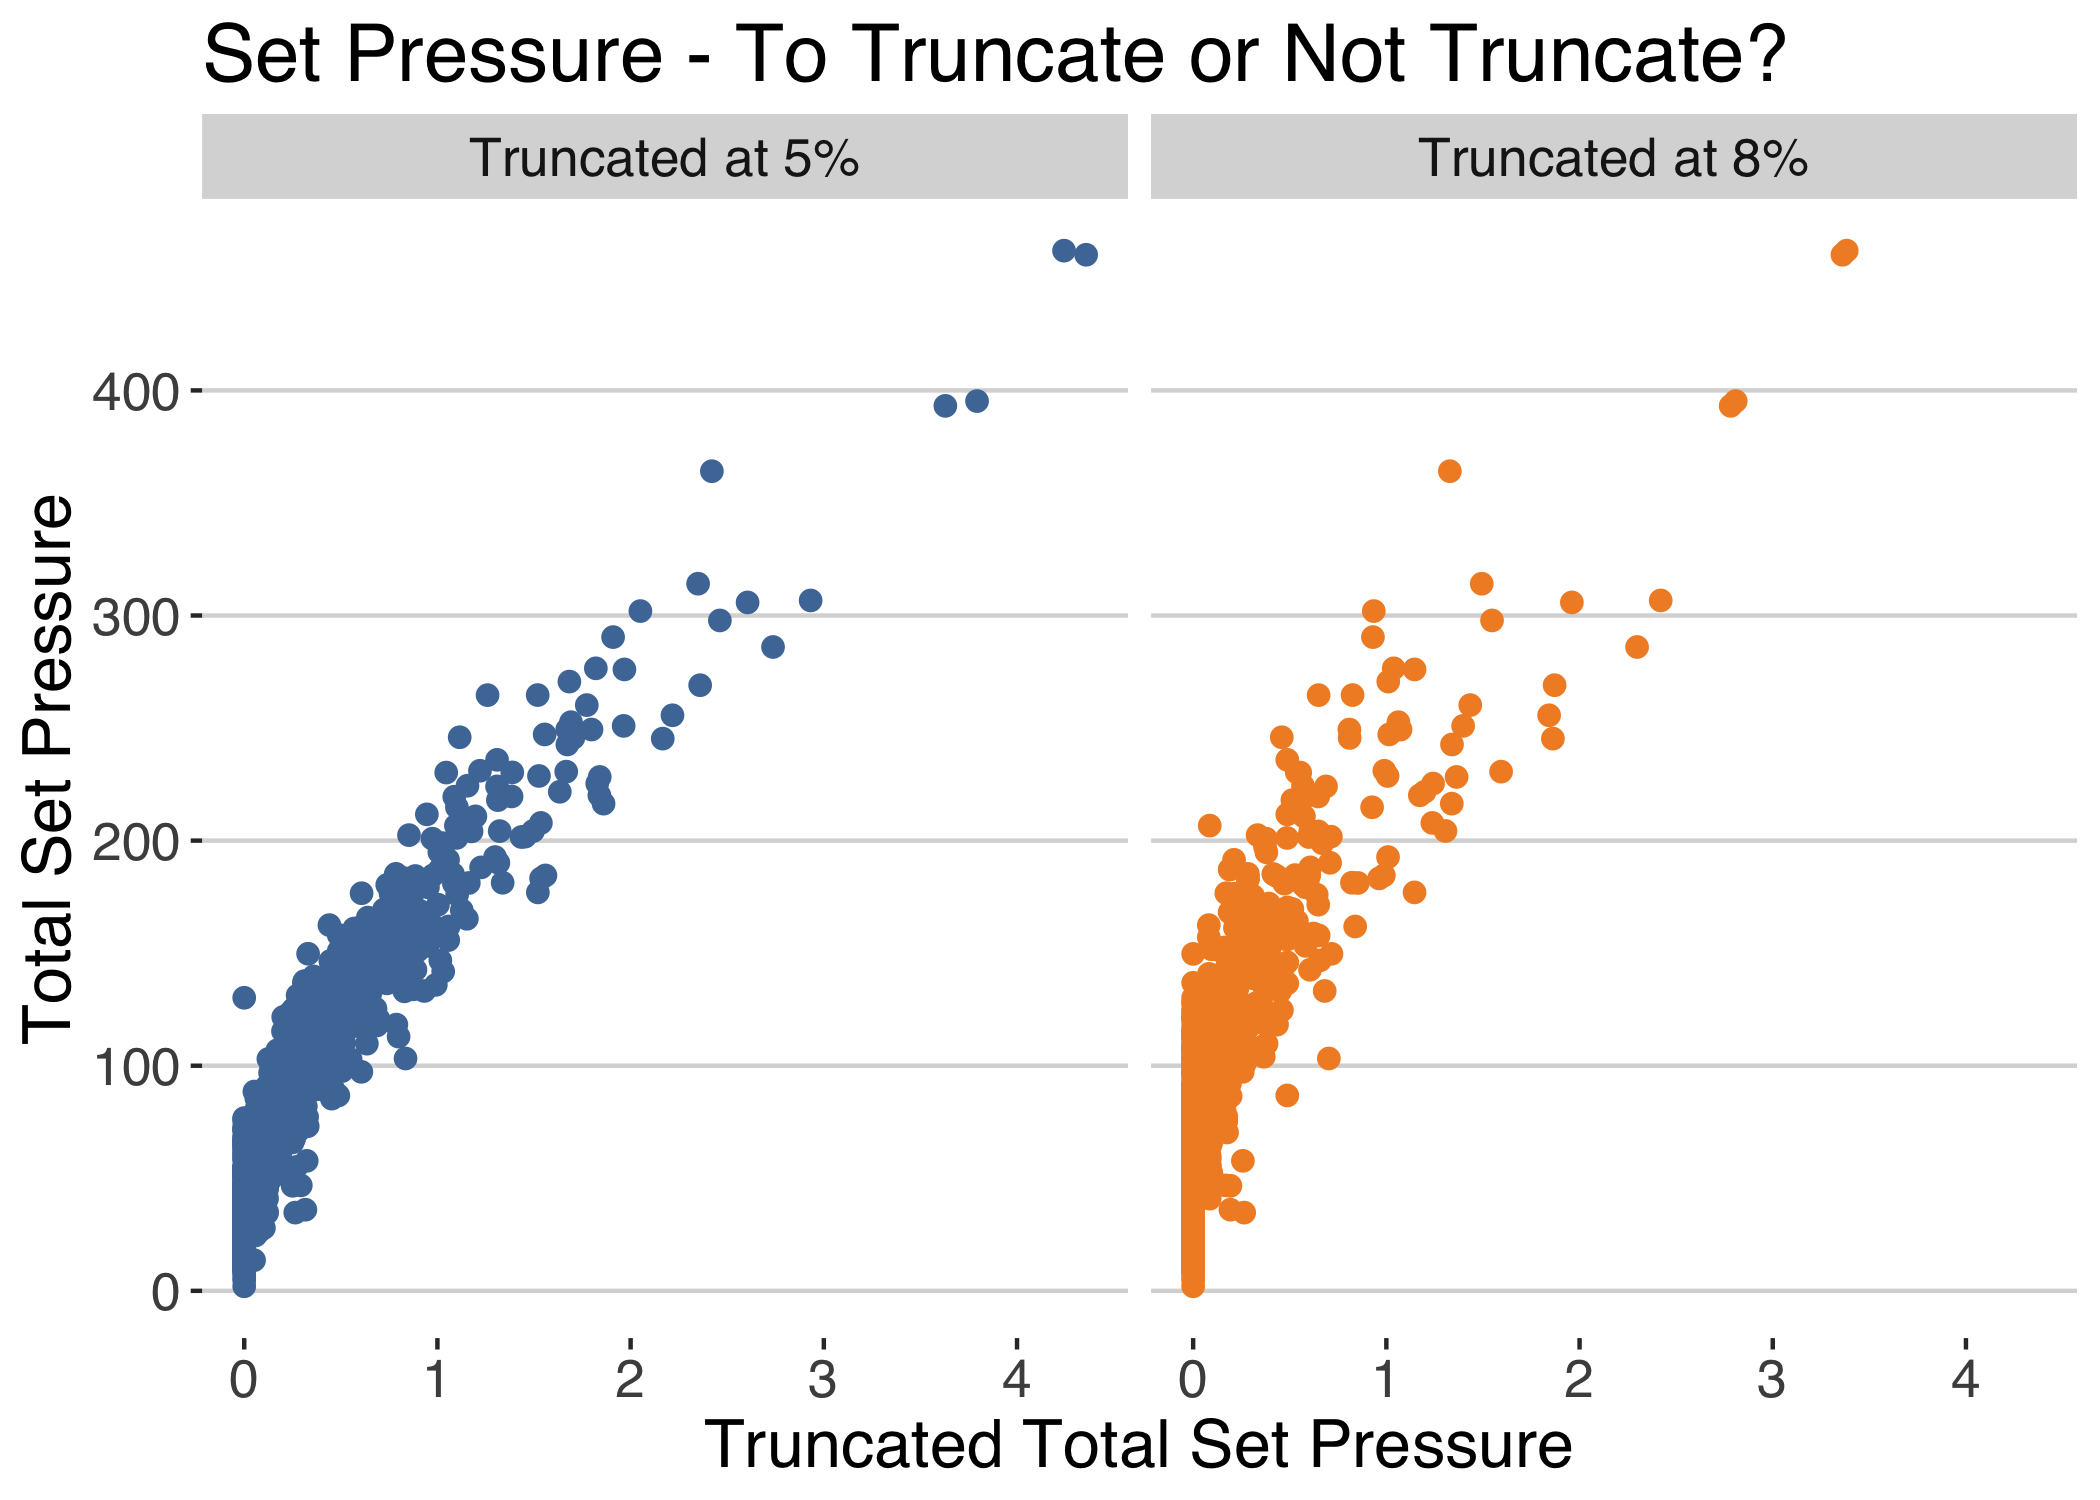
All of the options have a strong correlation but we can see that the pressure total rises much more sharply without truncation. In fact, in the sets with greatest pressure, we can see values above 400 when we take the untruncated sum. If we truncate at a pressure of 8%, however, we rarely see sums above 300.
Break Point Equivalents
Whatever of the pressure totals we prefer, we still need to translate them into meaningful units. That is what motivated this whole post in the first place.
Above, we saw that the most pressure-filled break situation is a match-deciding break point. The pressure score of that point is 25%. In other words, the most a server has the potential to lose when a game away from winning the match against an equal opponent is 0.25 in absolute probability.
Now, this isn’t the stereotypical break point situation, but it is a useful reference point. It is the kind of situation, like when Naomi Osaka lost 3 match points to go to a third set in the women’s final, that stays engrained in your memory of pressure points.
If we divide our set pressure score by 25, we can interpret those scores in units of ‘break point equivalents’. This doesn’t change the rankings of those sets but it gives a nice way to interpret what the scoreboard pressure of the set might have felt like for the server.
Set Pressure Rankings at the 2019 Australian Open
What would the set pressure scores in break point equivalent units (I’ll call BPEs for short) tell us about the highest pressure sets for male servers at the 2019 Australian Open? Let’s consider two versionsL one based on the total pressure on serve and one based on the truncated pressure at 8%.
The table below shows the top 10 set BPEs with the total and truncated pressure scores. Both measures agree on the sets that make the top 4 though the order differs, the total BPEs giving the highest pressure serving experience to Ugo Humbert’s 5th set against Jeremy Chardy in the first round. This was the first match to put the new super tiebreak rule at the 2019 Australian Open to the test. By the end of the set, Humbert had faced 12 break points and 17 BPEs in terms of the truncated pressure.
We start to see a divergence in whether we consider all pressure or not when we get to the 5th rank and lower. Taylor Fritz’s 2nd round victory over Gael Monfils is a good example of how the methods contrast. The 3rd set of that 4th set match, when Fritz and Monfils were both at 1-set all, would receive the 5th highest pressure score for a set if we consider the pressure of all points. However, it would be 9th if we limited the pressure total to points of >8% total pressure. In fact, the BPEs with the truncated score would be only 10.
Which is the better choice in this case? We see that the actual break points Fritz faced was 5 in that set, making the truncated BPEs twice the observed break points. Considering that the set was close enough to go to a tiebreak might make this much of a relative increase in pressure reasonable. On the other hand, it seems strange to give a set that wasn’t a match-deciding set a ranking as high as 5.
Still, if we look at what ranks 5th with the truncated BPEs, we end up with Carreno Busta’s 5th set over Luca Vanni in the first round. Carreno Busta never faced a service break in that set but he did get behind on serve at times in a match-deciding set. Still, it looks like the truncated BPEs might be overly emphasising end-of-match situations than we would like for a stat of set service pressure.
| Round | Server | Set | Total BPEs | Total Rank | Truncated BPEs | Truncated Rank |
|---|---|---|---|---|---|---|
| 1 | Humbert | 5 | 18 | 1 | 17 | 2 |
| 4 | Nishikori | 5 | 18 | 2 | 17 | 1 |
| 2 | Opelka | 5 | 16 | 3 | 15 | 3 |
| 2 | Nishikori | 5 | 16 | 4 | 15 | 4 |
| 2 | Fritz | 3 | 15 | 5 | 10 | 9 |
| 2 | Simon | 4 | 13 | 6 | 9 | 11 |
| 1 | Carreno Busta | 5 | 12 | 7 | 12 | 5 |
| 4 | Cilic | 5 | 12 | 8 | 10 | 7 |
| 2 | Fritz | 4 | 12 | 9 | 8 | 14 |
| 1 | Chardy | 5 | 12 | 10 | 10 | 8 |
| 2 | Sousa | 5 | 11 | 12 | 11 | 6 |
| 2 | Millman | 5 | 11 | 16 | 9 | 10 |
So it isn’t clear that we have or ever will find the ‘best’ measure of pressure. But I think and hope the examples above have shown that pressure expressed in BPEs is a useful start.