Does WTA Depth Explain How Wild 2018 Wimbledon Was?
At the 2018 Wimbledon, the women’s seeds struggled to an unprecedented degree. Was this bad luck? Or a sign of the competitiveness of the women’s tour?
By now, the record upsets at the 2018 Wimbledon— eventually won by 11th seed Angelqieu Kerber—are well known. We previously discussed on this site how only 2 of the top 8 seeds, Karolina Pliskova and Simona Halep, reached the 3rd round, making it the lowest number of top 8 women to have such early exits of any slam since their expansion to 32 seeds. And with Halep losing in the third and Pliskova losing in the fourth rounds that meant no top 8 seeds was among the quarterfinalists, something that has never happened before at a men’s or women’s Grand Slam event.
So, yes, this year’s Wimbledon was wild in terms of upsets. But why? Should we chalk up the event to a chance outlier in the 132nd trial of the tournament? Or does such a surprising outcome suggest a more systematic cause?
The main theory that has been put out there is depth. The depth theory says that the margins separating one top player from another have gotten incredibly narrow. So seedings reflect less about a player’s ability to win on any particular day than it has in the past.
Is there anything to support the depth theory? To find support we have to go beyond seedings or the official rankings that feed into them. This is where player Elo ratings–a much discussed stat on this site–can be particularly useful.
The Elo is as pure a measure of player ability as we have in tennis. If the depth theory is right, we would expect Elo ratings to have gotten more clustered. In other words the gap between the rating of the 7th best player and the 8th best player or the 100th best player and the 101st would be smaller now than in previous years.
Is that the case?
The curves below show how much differences in Elo ratings accumulated from the highest to lowest ranked players going into the Wimbledon main draw between 2010 and 2018. When the curve gain more slowly with ranking, that is a sign that there is less differentiating one player rating to the next, that is a sign of depth. On this basis, the years 2016 to 2018 show the most depth.
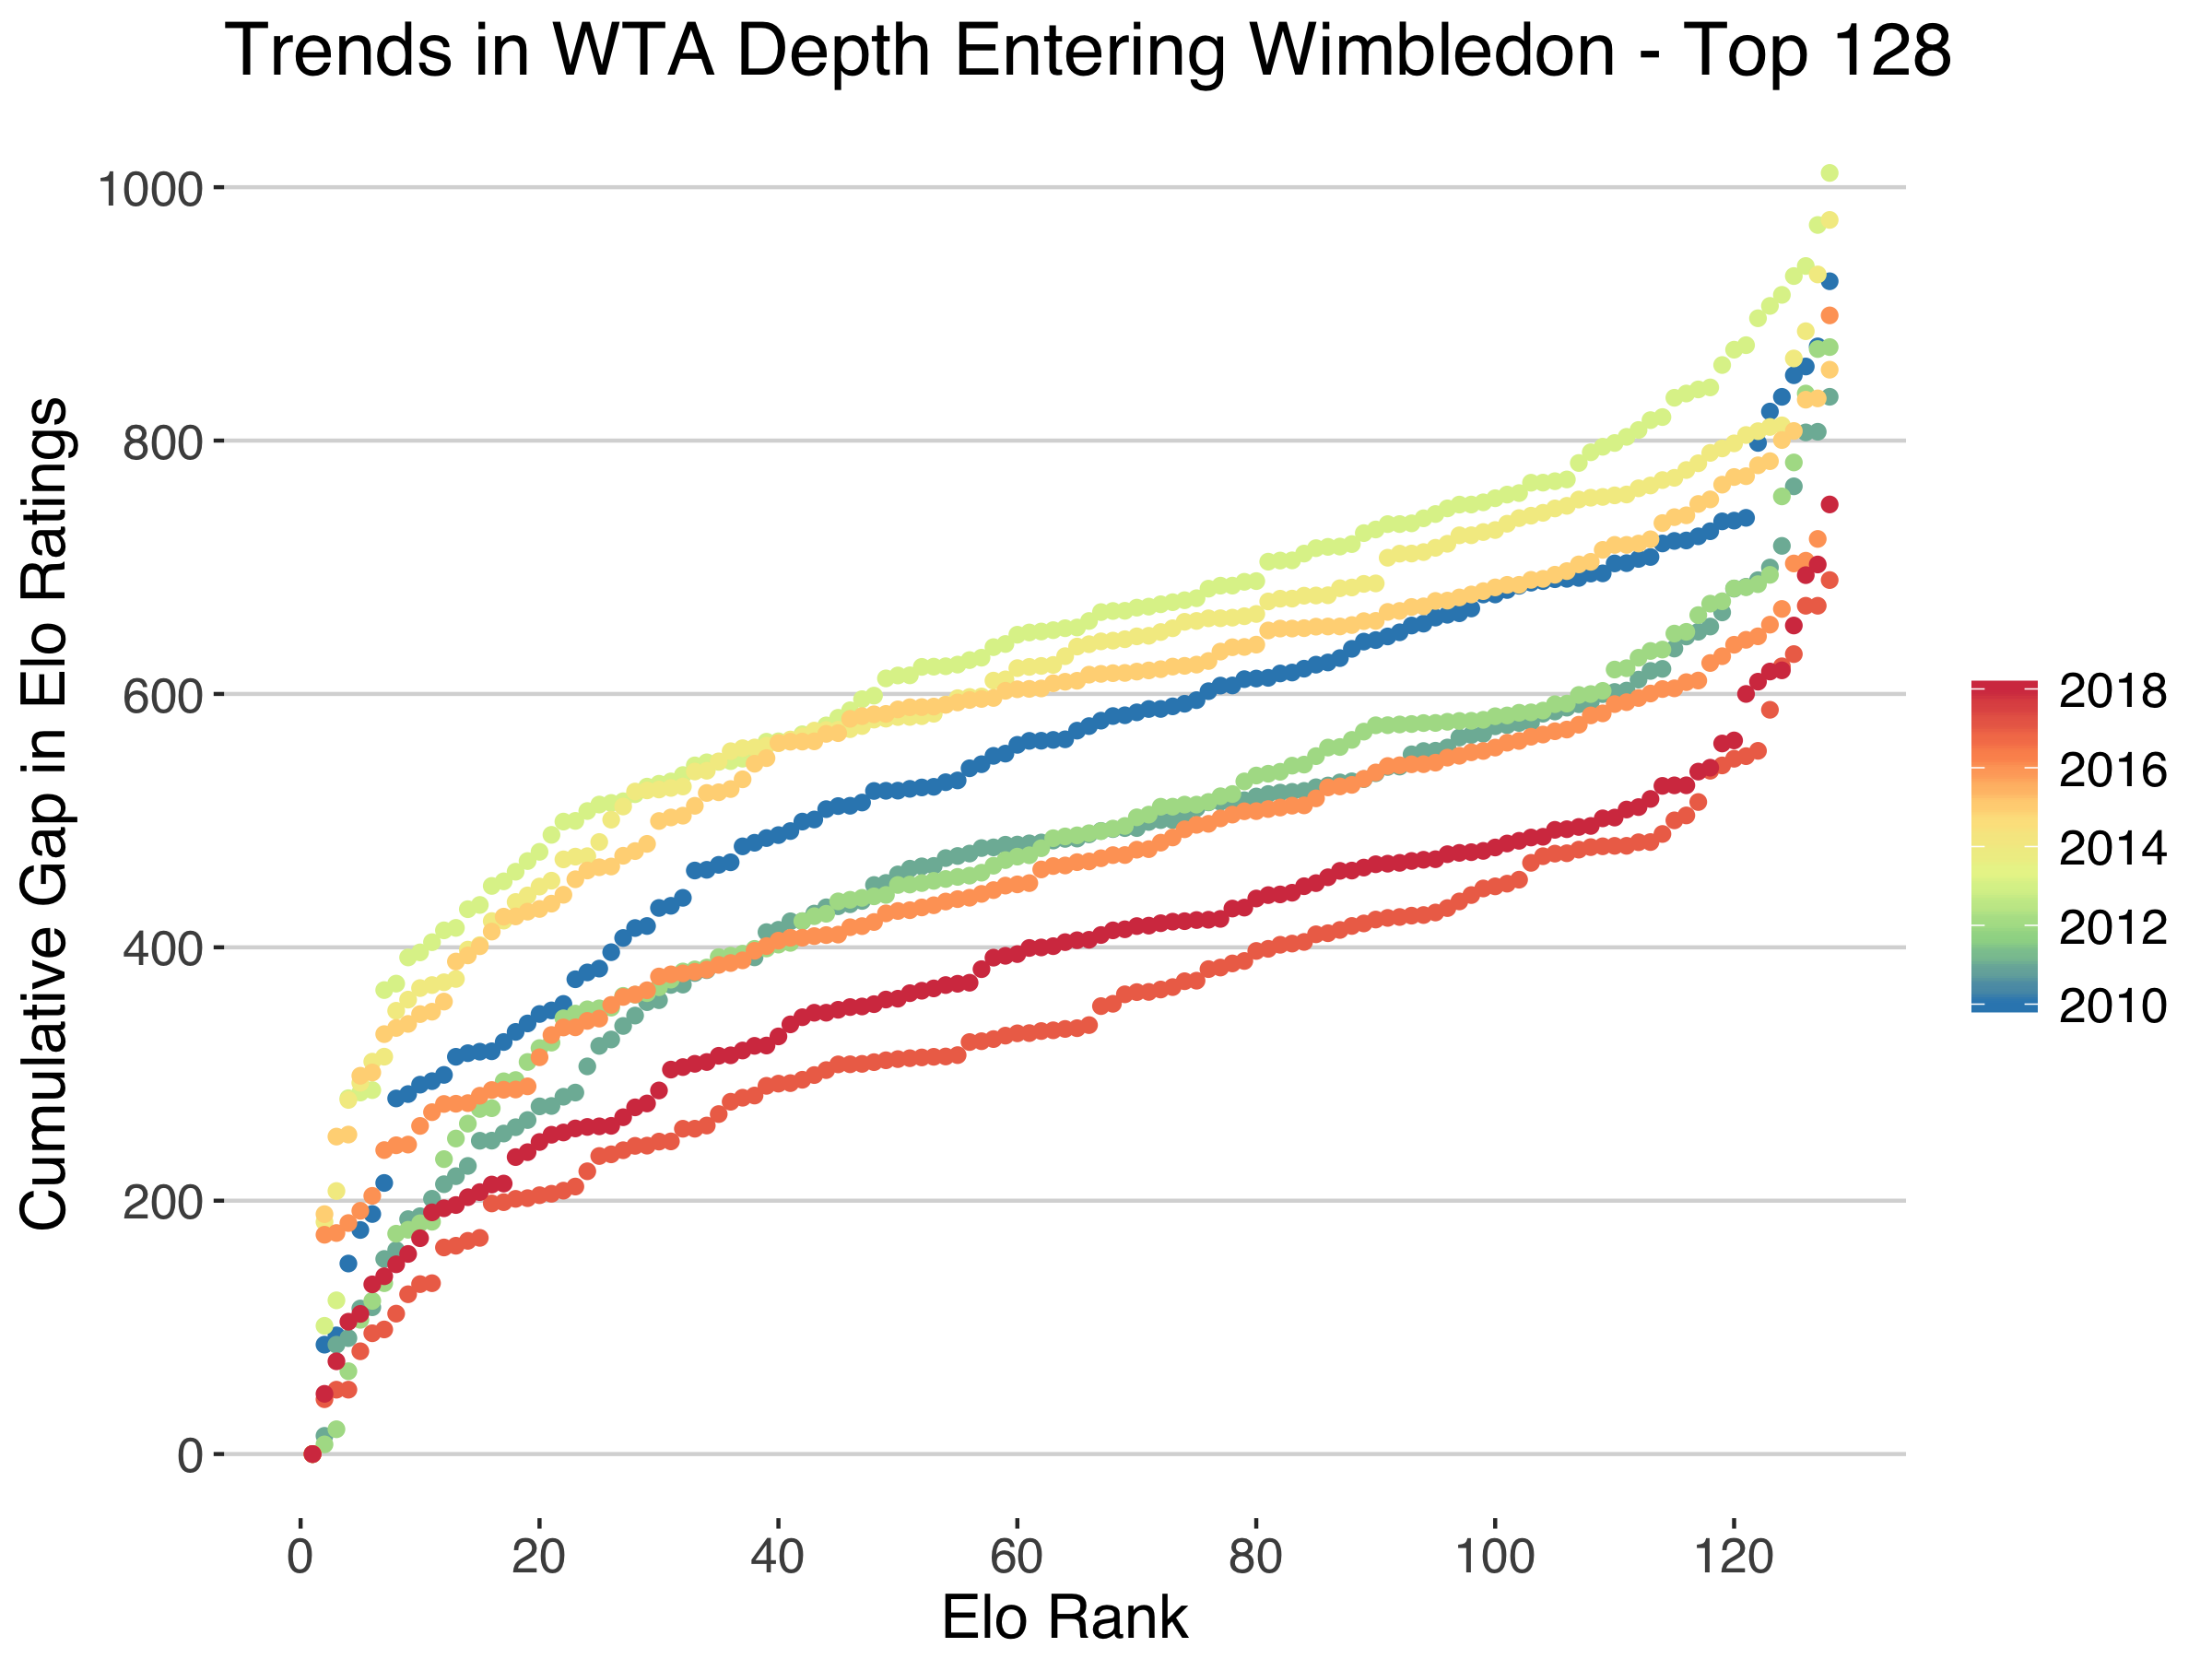
From the above curves, for example, the total difference in ratings for the first half of the draw was 404, which means an average difference of just 6 points in Elo ratings for players differing by only one ranking position. 2017 showed an even tighter group in terms of ability with an average 5 point difference for the top 64, while 2013 had twice that average gap, the biggest difference across all of these years.
Of course, the ratings don’t vary linearly. We expect ratings to be closer to a power law, with the highest ranked players being orders of magnitude above the players just below them in the ranking. One might wonder if, by looking at the cumulative differences, we are merely picking up closer ratings at the top of the game.
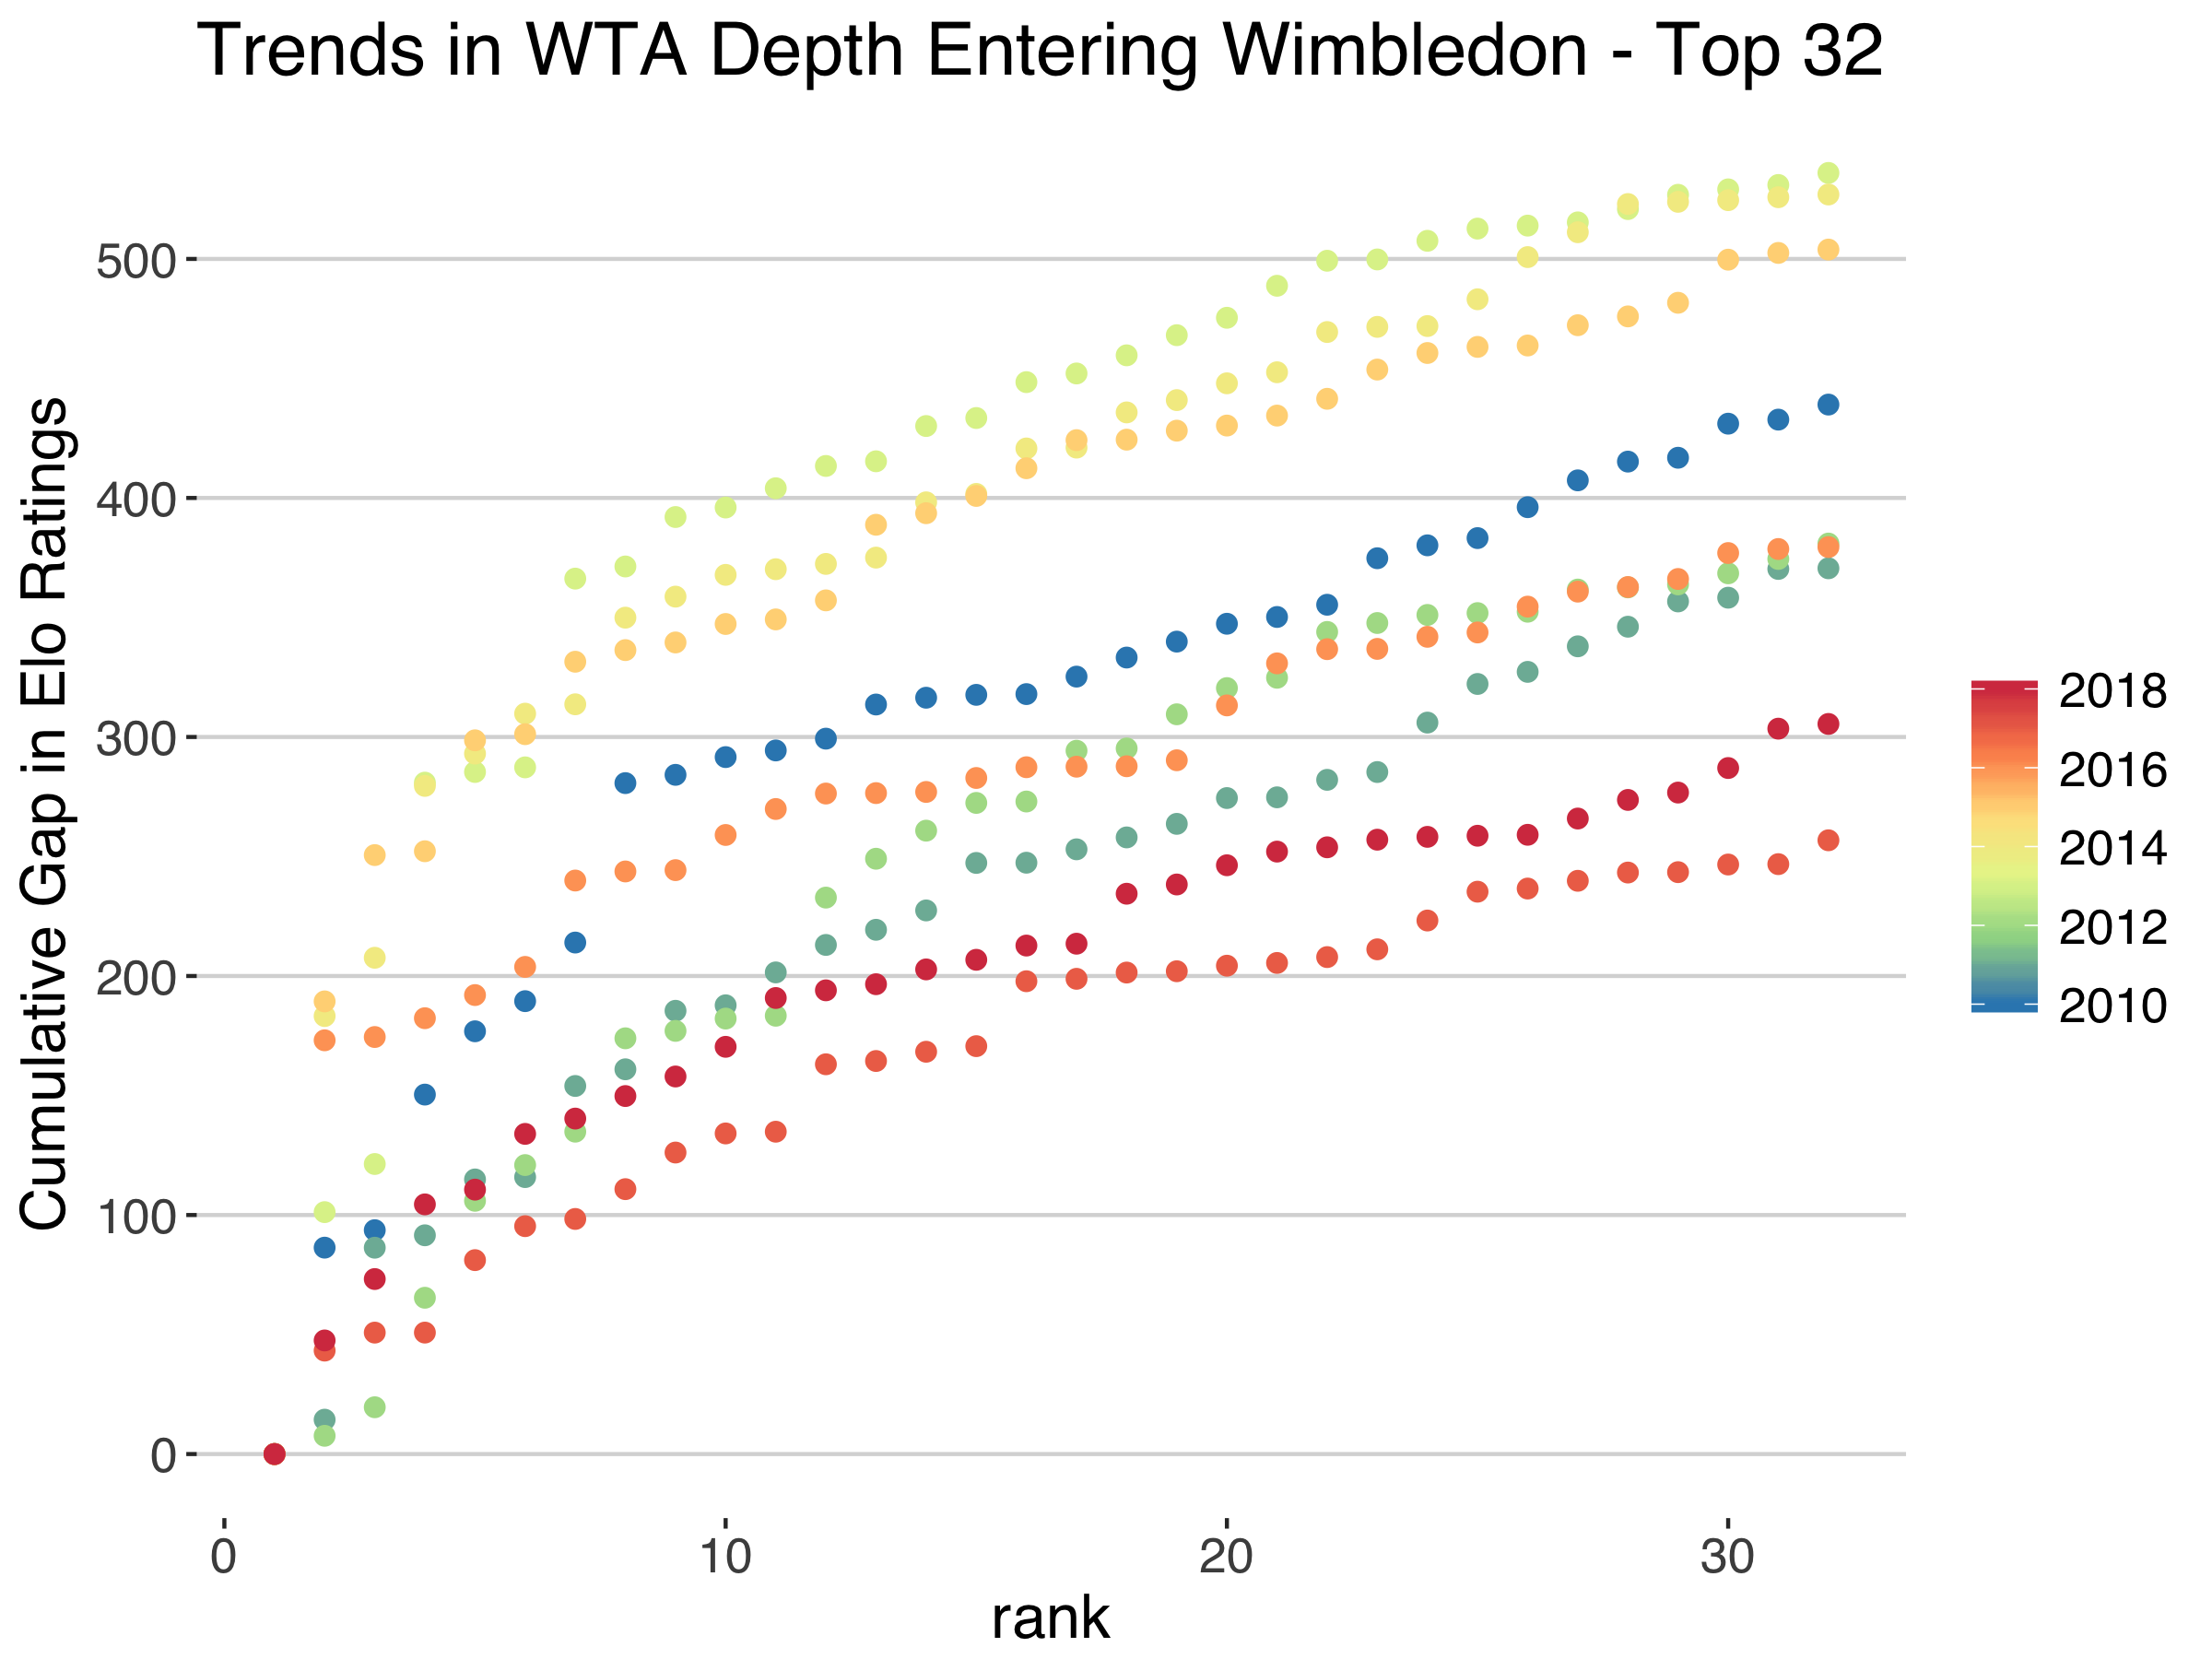
We can get some idea about that by zooming in on the rise in rating differences among the top 32 players. The chart below does this and shows that there is less of a gap for the top 5 in recent years than five years ago, where we see the 2013 curve, for example, jumping to nearly 400 points by the 10th ranked player. At the same time, we see a flatter curve from the 10th to 32nd ranking for 2017 and 2018 compared to the rest. This tells us that the differences at the top can’t entirely explain the behaviour of these curves: greater depth in general is also at play.
The evidence from differences in Elo ratings do provide some support for the depth argument. Though it is interesting to see that, on these stats alone, 2017 (when 3 of the top 8 seeds reached the quarterfinals) would have been the year we expected the greatest number of upsets rather than 2018. If there is still a method behind the madness at SW19 this year it may mean looking beyond depth to factors like grass preparation, warm-up schedules, and a general turning away from the attacking style of play that grass most rewards.