Research Highlights from 2018 MIT Sloan Analytics Conference
This week the MIT Sloan Analytics Conference will showcase some of the cutting-edge research happening in sports statistics. What do the themes from this year suggest about the state-of-the-art in quantitative work in sport?
This weekend ‘analytics’ will be the topic of the sports world as the 12th MIT Sloan Sports Analytics Conference (SSAC) unfolds in Boston.
With each year, SSAC seems to get bigger and attract bigger names in sport. And this year, alongside the Sam Hinkies and John Hollingers of the front office, world-famous sports fan President Barack Obama will be among the speakers.
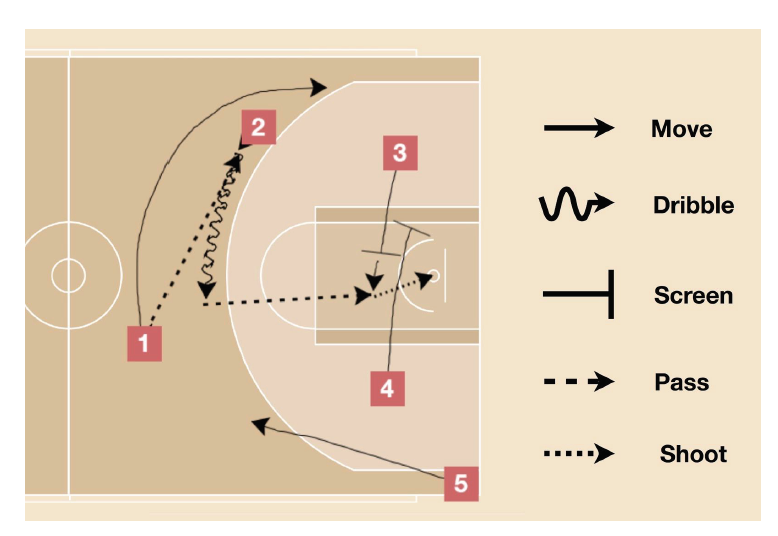
Source: Seidl et al. "Bhostgusters" SSAC 2018 Research Paper
Looking over the speaker list, one might wonder if a sports statistician can hope to learn anything from SSAC or if it’s just a schmooze fest for industry big wigs? In my experience, it’s a bit of both. But for the diehard stats-heads, focusing on the research track of the program will bring you the best experience.
The hard number-crunching of sports research makes up only a fraction of the SSAC agenda: there are just 8 papers and 12 posters being presented this year. Yet, because of its highly selective process, what does appear in the research track is usually of high-quality and gives a good snapshot of what some of the brightest minds working in sports stats are up to (albeit with a heavy American bias).
So what does 2018’s SSAC research track tell us about the state of sports analytics?
Sports
Let’s start with the sports represented by the research papers and posters this year. With 2 papers and 6 posters—50% of all posters—, basketball is the most popular sport for research at 2018 Sloan. Most of the basketball applications focus on the NBA, with one project working with NCAA data (Sailofsky, ‘Drafting Errors’), and another with primary data of amateur players collected from GoPro cameras (Bertasius et al., ‘Learning an Egocentric Basketball Ghosting Model’)'.
Two other sports, American football and baseball, each had 2 papers accepted. That completes an American team-sport triumvirate among the research paper finalists.
Outside of the most popular American sports, soccer (or Association Football) is the most represented in the research, with 1 research paper and 3 posters.
The research papers are rounded out by a project in eSports (Maymin, ‘An Open-Sourced Optical Tracking and Advanced eSports Analytics Platform for League of Legends’), only the second to my knowledge at Sloan.
Tennis and hockey each get 1 poster, though the study with the hockey application also includes a basketball application. The tennis paper comes out of my own group, the Game Insight Group (Kovalchik and Reid, ‘Going Inside the Inner Game’).
All in all, the count alone would suggest that basketball is generating the most sports stats research. However, given the North American-bias among submissions and reviewers at SSAC, this may not reflect the broader trends in sports stats research around the world.
| Sport | Paper | Poster |
|---|---|---|
| American Football | 2 | 1 |
| Soccer | 1 | 3 |
| Basketball | 2 | 6 |
| Baseball | 2 | 0 |
| Hockey | 0 | 1 |
| eSports | 1 | 0 |
| Tennis | 0 | 1 |
| General Team Sports | 0 | 1 |
Topics
There aren’t topics and keywords included with the Sloan research studies. This makes categorizing the main research question of each paper a subjective process. Having read through all the papers, I think the breakdown below is a reasonable summary of the main problem addressed in each.
The standout topics among the research papers were new performance metrics and studies on skill evaluation, each topic having 2 papers each. Identifying playing styles and playing patterns were the focus of one paper each. The most novel of the group in terms of subject was a study on injury prediction (Ward et al., ‘Volume and Intensity are Important Training Related Factors in Injury’) and a study on daily fantasy portfolio management (Haugh and Singal, ‘How to Play Strategically in Fantasy Sports (and Win)')’.
With 50% more posters than papers, the diversity in topic is greater among this group. Only one topic predominated at that was strategy evaluation, most of those coming from the soccer and basketball research of Luke Bornn and co-authors.
Two studies examined methods to identify patterns of play, while two other projects among the research posters presented approaches for automatic labelling of film/vision.
Some popular topics in the past, draft evaluation and performance metrics, were less represented, having just 1 poster each. Curiously, despite the interest in scheduling problems on the industry-side there wasn’t one study on scheduling in the SSAC research track in 2018.
| Topic | Paper | Poster |
|---|---|---|
| Fantasy portfolio strategy | 1 | 0 |
| Player performance metrics | 2 | 1 |
| Injury prediction | 1 | 1 |
| Play pattern identification | 1 | 2 |
| Skill evaluation | 2 | 0 |
| Playing styles | 1 | 0 |
| Draft decision-making | 0 | 1 |
| Strategy evaluation | 0 | 4 |
| Stat reporting | 0 | 1 |
| Film labelling | 0 | 2 |
Data
Working with some of the most prized data in sport is often a feature of SSAC research. As a general category, tracking data was the most common type of data, with 12 of the 20 papers using some form of tracking data. Tracking from the multi-camera system provided by STATS SportsVU was the most common supplier, providing data for 4 of the studies. While camera-based tracking was still the most common method for the positional data among the Sloan papers, it is interesting to see some alternatives coming from optical tracking and sensors.
Most of the remaining studies had done primary data collection for their research, two of those included the manual labelling of vision. In these cases, the data sets were designed and collected specifically for the research question of interest.
Three studies (1 paper and 2 poster) used play-by-play data from the public domain. As most tracking data and primary data is proprietary, it is encouraging to see that it is still possible to do novel research with openly available sports data that can earn a spot on the SSAC research program.
| Data | Paper | Poster |
|---|---|---|
| FanDeul | 1 | 0 |
| Optical tracking (primary) | 1 | 0 |
| Metrica Sports tracking | 1 | 0 |
| Nike Sensory Battery | 1 | 0 |
| Noahlytics | 1 | 0 |
| STATS sportsVU | 1 | 3 |
| Sensor data (primary) | 1 | 0 |
| Play-by-play | 1 | 2 |
| Training (primary) | 0 | 1 |
| Hudl tracking data | 0 | 1 |
| SPORTLOGiQ | 0 | 1 |
| GoPro (primary) | 0 | 1 |
| EPL tracking data | 0 | 2 |
| Labelled film (primary) | 0 | 2 |
Method
Looking over the core method of each research paper and poster there was one strong and persistent theme: neural networks. 8 of the 20 studies utilized some form of neural network as their primary tool. There are two reasons why this might be less surprising than this stat implies. First, ‘neural network’, as I am using it here, is quite broad and encompasses a variety of models: convolutional neural network, recurrent neural networks, etc. Also, given the popularity of neural nets for tracking data and vision, the amount of tracking data used in the SSAC research makes the methods results more expected.
I was particularly interested to seem applications of trajectory clustering (Hobbs et al., ‘Quantifying the Value of Transitions’) and reinforcement learning (Wang et al., ‘The Advantage of Doubling’) among the papers, the former because it seems so well suited to a lot of tracking data problems and the latter because it fits so naturally with strategy evaluation. Formal Bayesian models make an appearance in two of the papers while two others managed to wow the SSAC reviewers with plain old linear regression.
| Method | Paper | Poster |
|---|---|---|
| Linear Regression | 1 | 1 |
| Non-linear Regression | 1 | 0 |
| Bayesian | 1 | 1 |
| Neural Network | 3 | 5 |
| Boosting | 1 | 0 |
| Trajectory clustering | 0 | 1 |
| Markov decision process | 0 | 1 |
| Reinforcement Learning | 0 | 1 |
| Mixed methods | 1 | 2 |
Summary
Even considering the American sports emphasis at Sloan, it is interesting that a field that was really propelled by American baseball gets more and more basketball-heavy with each year (the slice we see at SSAC, anyway). With the field being so small, much of these trends must be driven by a small number of research groups, headed by the Bornns, Luceys, and Goldsberrys of the analytics world, and trends in data availability. Clearly, there is a lot more to the story of the evolution of sports analytics than what one conference can tell us, but it is a revealing few days nonetheless.
If you want to read any of the studies included in the SSAC 2018 papers and posters, they are all available to download here.