Sizing Up Federer's Seasons
The “resurgence” of Roger Federer has been one of the biggest storylines of the 2017 season. After the end of Federer’s season at the ATP Tour Finals, how does it rank among his past seasons? and what is the best metric for judging season accomplishments?
With only 5 losses in 2017 and 2 Grand Slam titles, Roger Federer has generated new debate over the best seasons of his career. Have his achievements in 2017 outshone his performance in 2015? Has he returned to his 2005 level? Is this some kind of miraculous raising-of-the-game at 36 years old? And so on…
There is no definitive stat for judging the impressiveness of a season. Some focus on Slam results, some on win percentage, some like total matches won, etc. I thought, now that we are in the off-season, it would be interesting to go through a number of the common “season best” statistics and see what they suggest about Federer’s best years.
Titles
First, we consider titles won in each season, counting all tour-level events, Davis Cup, and Olympics. The table below shows Federer’s 10 best seasons according to total tiles earned. 2006 lands on top with 12 titles, with 2004 and 2005 both contending for second place with 11 titles.
If we focus just on Major titles, Federer has had 3 seasons with a calendar 3 Slams: 2004, 2006 and 2007. Although 2017 would come in 6th place according to total titles, it would be right alongside 2005 in terms of Grand Slam titles won. Interestingly, although Federer won the same tour titles in 2015, he failed to bag a single Slam.
| Rank | Year | Tour Titles | Slam Titles |
|---|---|---|---|
| 1 | 2006 | 12 | 3 |
| 2 | 2004 | 11 | 3 |
| 3 | 2005 | 11 | 2 |
| 4 | 2007 | 8 | 3 |
| 5 | 2003 | 7 | 1 |
| 6 | 2017 | 7 | 2 |
| 7 | 2012 | 6 | 1 |
| 8 | 2015 | 6 | 0 |
| 9 | 2010 | 5 | 1 |
| 10 | 2014 | 5 | 0 |
Win Percentage
While title count can tell us about how well a player is able to play consistently at a high-level, it ignores a player’s performance at any event where the player didn’t walk away with the trophy. Season win percentage gives the more comprehensive view of performance.
The chart below shows Federer’s win percentage from his earliest Pro season to the present. There is a clear peak in the early 2000s where Federer had his only string of 90%+ seasons from 2004 to 2006. The 95% win percentages Federer achieved in 2005 and 2006 were the highest of his career.
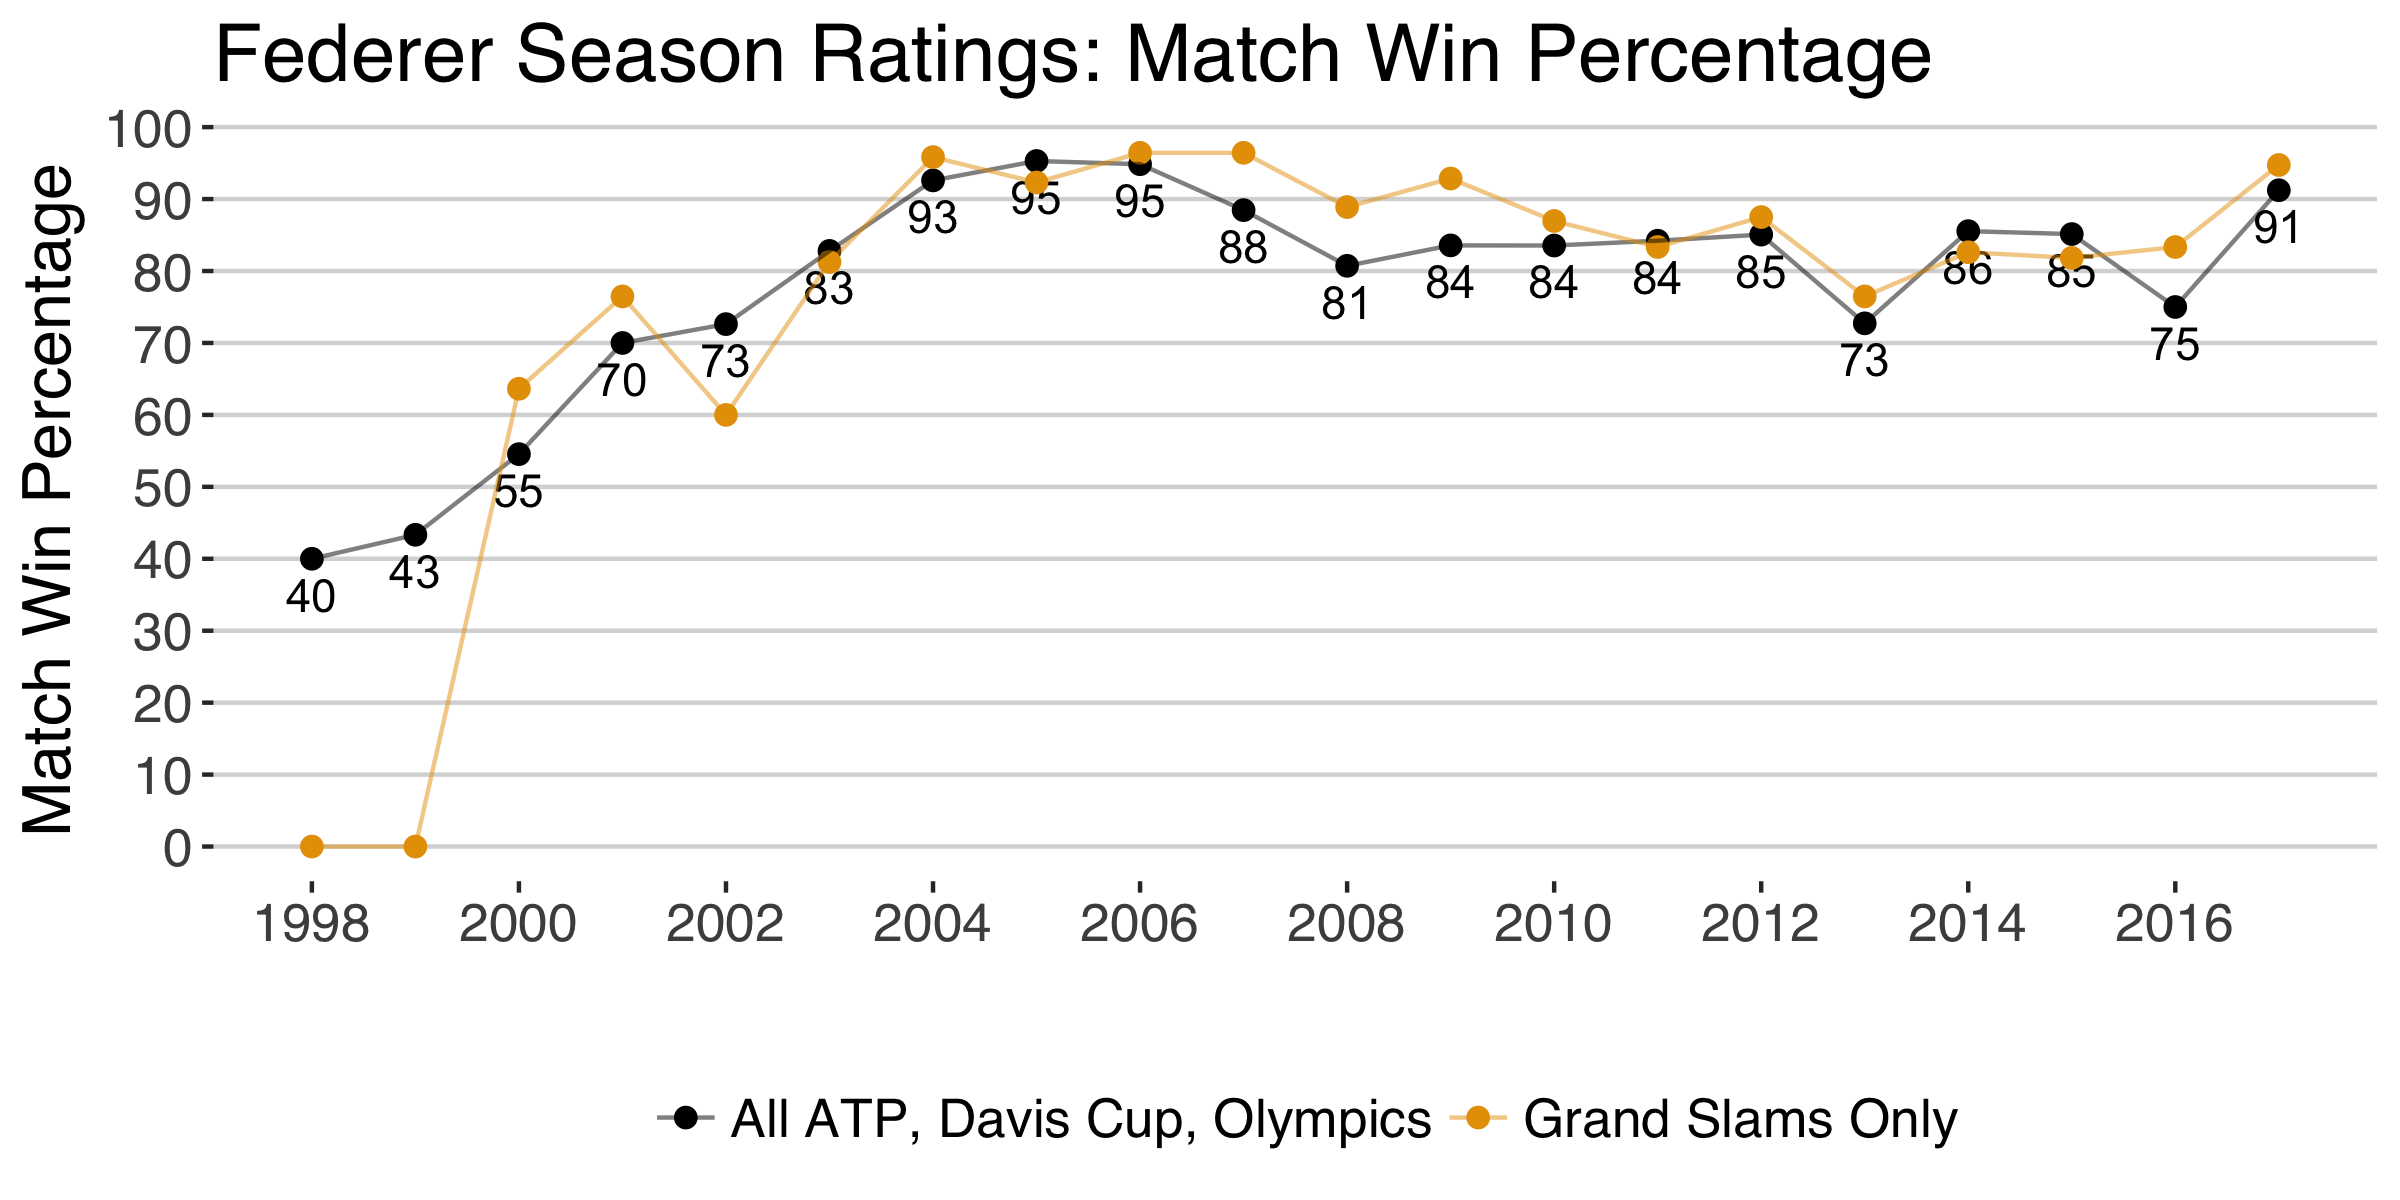
In fact, since 2006, Federer has only played above a 90% win percentage this year, which could explain why 2017 has been a standout in so much commentary.
One could argue that win percentage doesn’t put enough emphasis on the big stages or how well a player closes out a title run. To account more for these factors, we can focus on the win percentage at the Majors (as shown in gold). When we do this, it is interesting to see that Federer appears to have maintained a higher level of play throughout the 2000s. It also makes his 2017, where he had just 1 loss at a Grand Slam, look even more on par with 2005 and 2006.
Cumulative Results with Difficulty Adjustment
A major problem with simple counts or percentages of results is that they ignore the person standing on the other side of the net. No two wins are exactly alike and a lot of that has to do with the difference in the quality of one’s opponent.
In the mid-2000s, Federer’s most likely opponent at a Grand Slam finals was Andy Roddick. Since 2015, he has most often come up against Novak Djokovic. Should this change how we measure his wins across seasons? I think so.
One way we can do this is with Elo ratings. At the beginning of a match, each player’s Elo rating tells gives us an expectation for the win, the higher the opponent’s rating (i.e. their difficulty) the lower a player’s chances will be. A player should get more credit for going above and beyond expectations and equally get less penalized for loses against top-notch opponents.
The cumulative match score with difficulty adjustment tries to make both of these adjustment. Here is how it works. A player gets a score for every win that is equal to their opponent’s win expectation against a player with an 1800 Elo rating (this is the typical minimum for a top 100 player). For losses, the player is deducted their actual win expectation, according to their pre-match Elo, so they get a bigger deduction the easier the win was expected to be for them. We then sum up the difficulty-weighted wins and losses over a season to get a total score.
When we look at the trends in Federer’s cumulative match score, it is interesting that his peak in the mid-2000s is even more prominent than with any of the standard title or win percentage stat. This suggests that there is much more variation within his match results that these standard stats gloss over.
2006 stands at as the strongest performance when we look at the cumulative difficulty of his results. What is really fascinating is that 2017 is so far below 2006 (-24.9 points). There are a few reasons for this. First, Federer was playing substantially more matches earlier in his career than he is now, famously skipping the clay seasons entirely this year. Second, the depth of the field has changed a lot from year to year and 2017 has had a surprising lack of depth owing to the slumps and injuries among the top-ranked males.
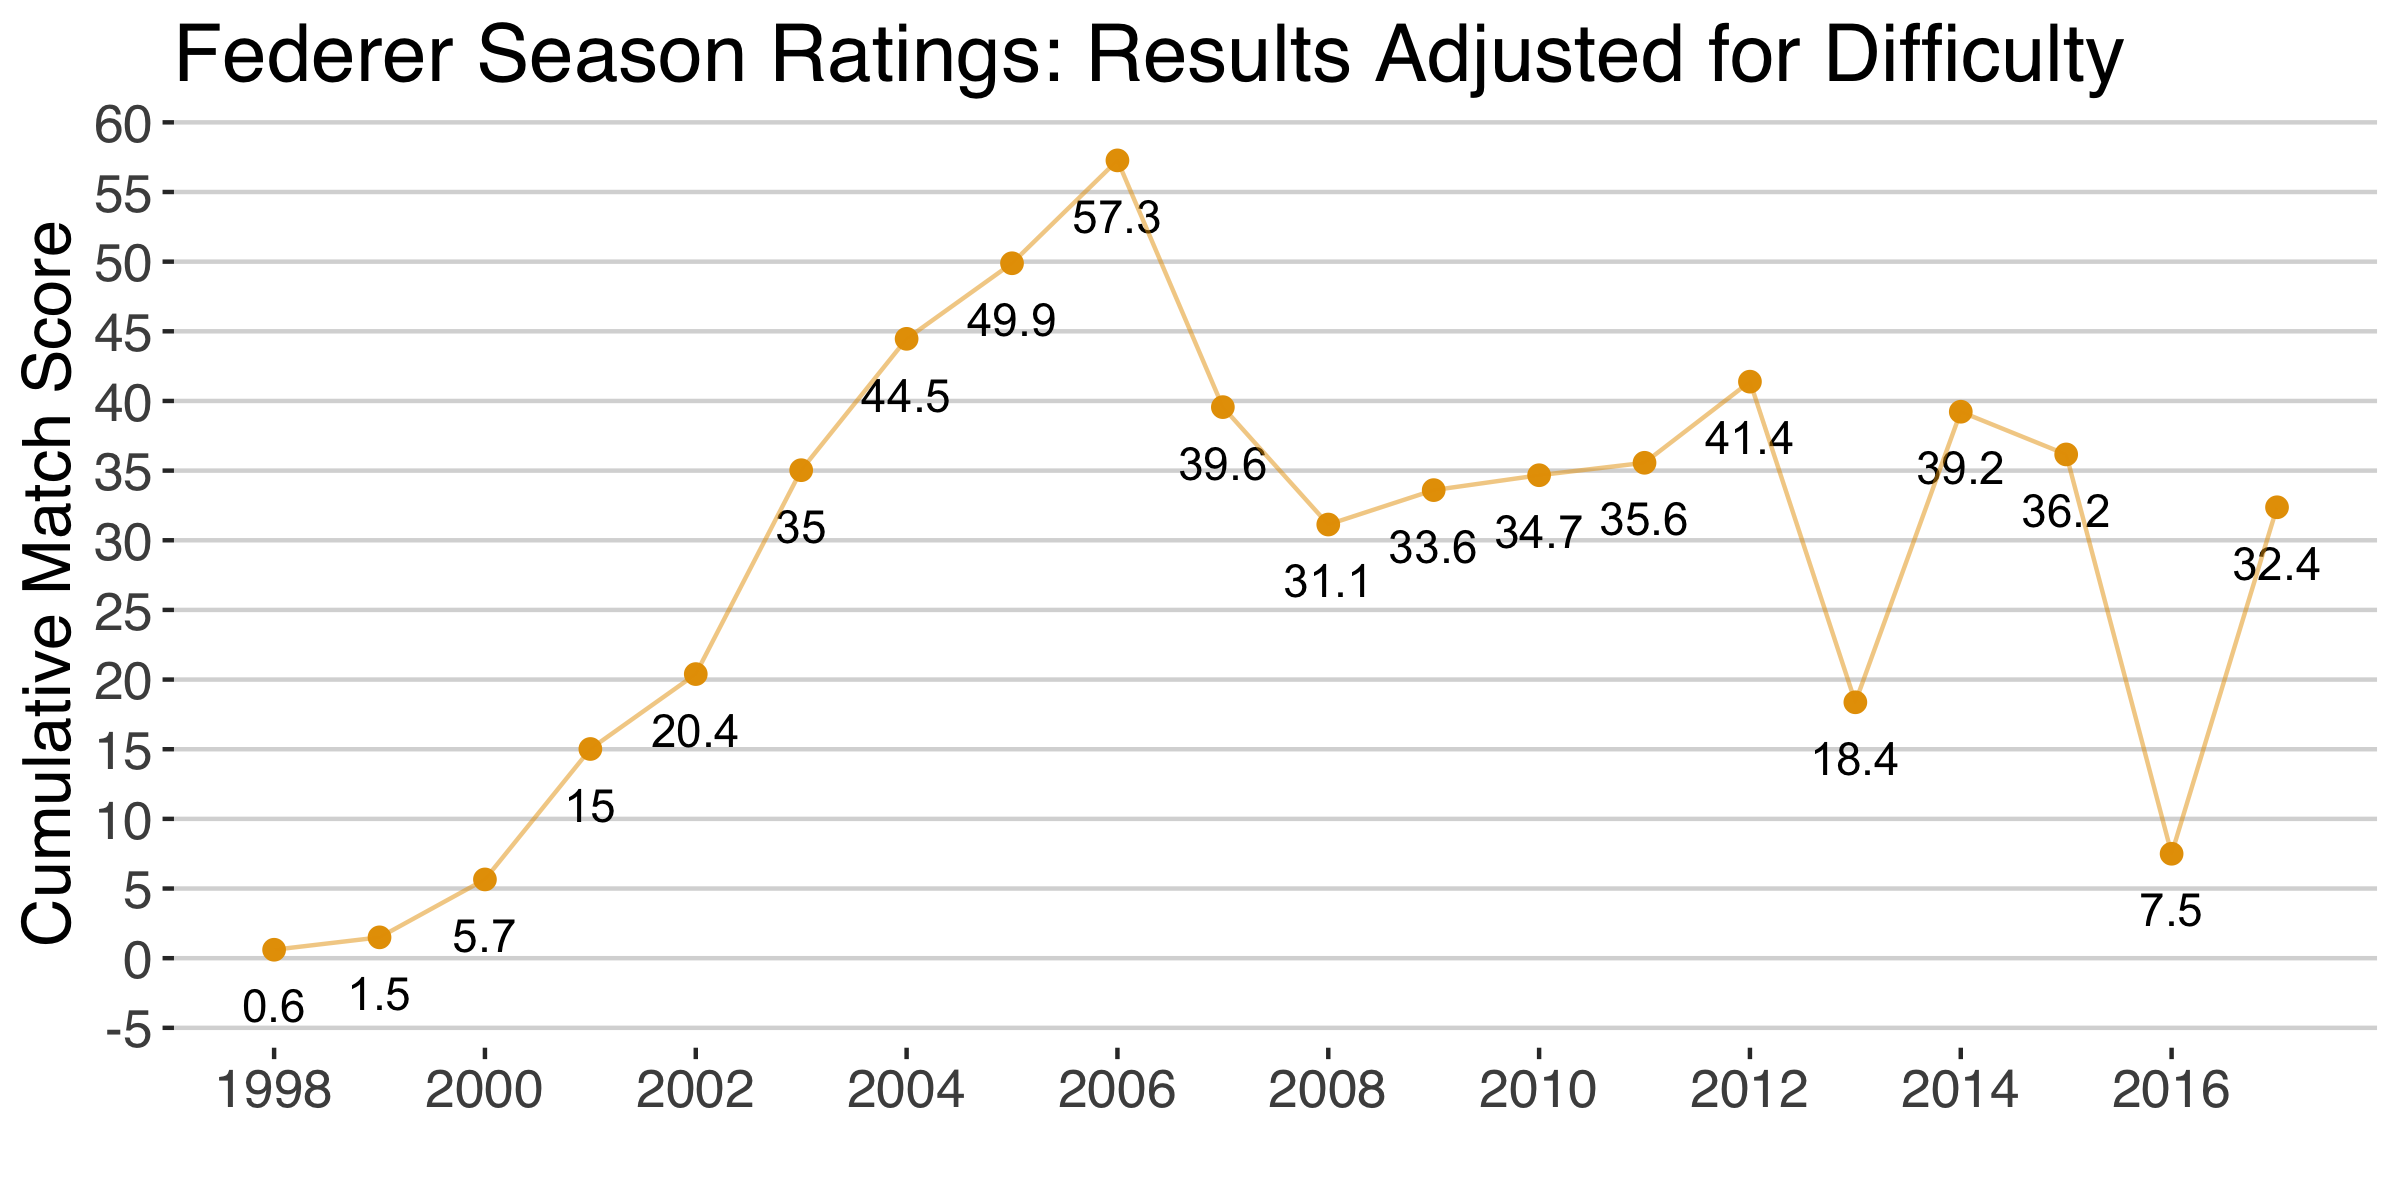
We can see the impact of depth most notably when we compare 2014 and 2015 against 2017. Both 2014 and 2015 beat Federer’s 2017 by several points. And, even if we removed the clay season in 2014, Federer would still beat his 2017 seasons score by a little over 5 points.
So, even with the Slam titles Federer has won in 2017, his handful of baffling losses and the general depletion at the top of the tour make a strong case for ranking 2014 and 2015 above this year in terms of overall performance.
The data and code for this post can be found here.