Clutch Edge at the 2016 U.S. Open
In the past few posts, I have been applying a new metric clutch averages to the men’s and women’s singles matches at the 2016 U.S. Open. The purpose of these averages is to focus on how players tend to perform on the most important points in a match. In this way, these stats can help us to find out which players win the majority of the most important points? And which players are most and least affected by the scoreline?
One of the things that is always a concern when interpreting stats in tennis is the opponent difficulty. If Thomaz Bellucci wins 60% of clutch points on serve against Novak Djokovic it is a more impressive result than if he were facing a tournament qualifier.
As a first step in trying to account for opponent, we can look at a player’s points won relative to the opponent’s points won. I call this a clutch edge. Suppose we have player 1 facing player 2 and use $Serve_i$ to signify the percentage of clutch serve points won by the ith player. The clutch edge can be calculated with the following math,
$$ \mbox{Clutch Edge} = Serve_1 - Serve_2 = Serve_1 - (1 - Return_1) $$
Because of the complementarity of service and return points won, we see that the edge is also a function of the total of a player’s clutch percentage on serve and return.
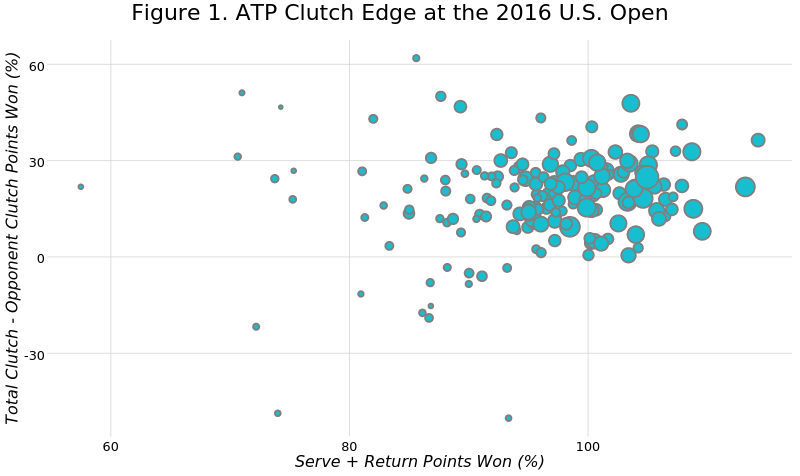
The following plot shows the clutch edge over all of an ATP player’s matches at the 2016 U.S. Open (you can hover over points to see the player represented). These values are plotted against the sum of the percentage of points won on serve and return, using the simple proportion. This sum is a way to evaluate a player’s quality during the tournament, with the best players tending to have a total sum of more then 100%. We see that there tends to be a positive relationship between the clutch edge and the overall performance on serve and return and that relationship becomes much more consistent in the highest quality range.
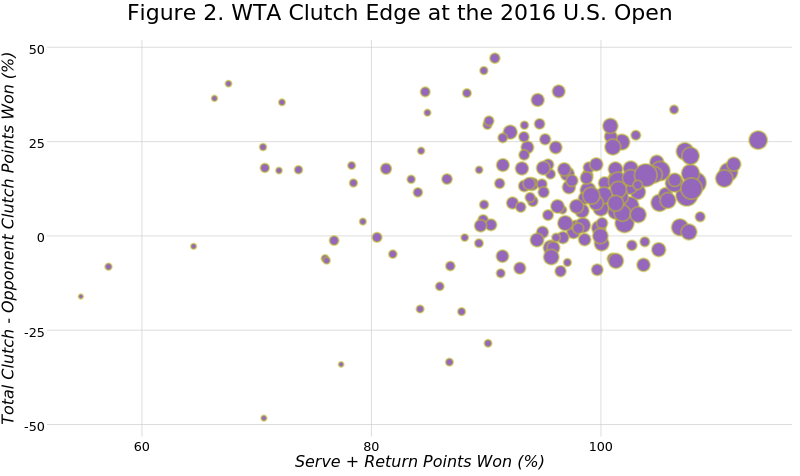
The pattern is quite similar among the WTA players. However, there is more noise below the 100% range along the x-axis. Because the sample sizes (shown by size of the bubbles) are also smaller in that range it is unclear if this is an effect of women playing fewer points at Grand Slams on average compared to men or a more general difference between genders.
The clutch edge stats shown above go some way toward accounting for the opposition in that they are a direct head-to-head comparison. However, they still ignore the quality of the opposition. We might, for example, expect that it is more difficult to have a high edge over a tougher opponent and should credit players more for smaller edges over bigger opponents. To test this idea, I ran a regression of the clutch edge for the player of higher quality, according to their Elo rating at the start of the tournament, against the player’s edge in Elo points. Each point below is per match for the ATP matches at this year’s U.S. Open.
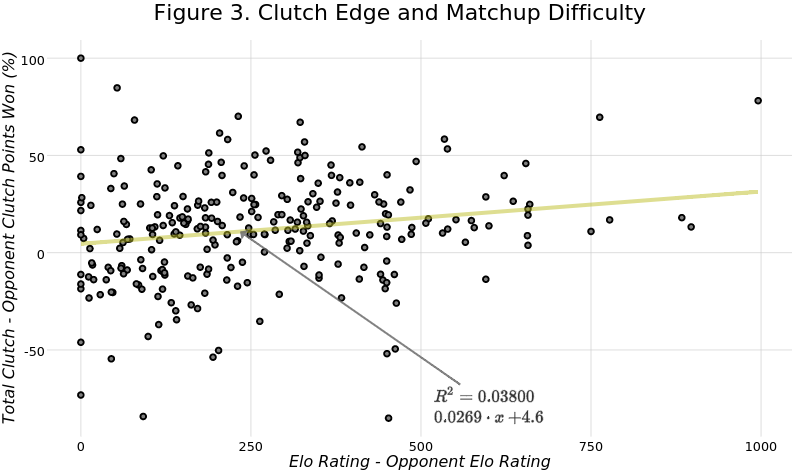
There is a weak positive relationship that suggests that the edge increases as the differential in Elo ratings increases. We also note that the variance is not constant across the Elo differentials as it becomes greatly reduced when players have large differences in Elo rating points. It also shows us that, when the quality of players is within hundreds of points of each other, the expected clutch edge is nearly zero with considerable variance.
The trends here show some support for our suspicion but the relationship is too noisy to allow for an adjustment. We will have to look for a stronger pattern between the edge stat and opposition difficulty before taking that step.