Klaassen & Magnus's 22 Myths of Tennis - Myth 14
Last weekend, when the sun finally shone down on Philippe Chatrier, we witnessed two very different but equally fascinating storylines emerge. On the women’s side, twenty-two year old Garbiñe Muguruza, a rising star with only one previous appearance in a Grand Slam final, thwarted Serena Williams' third bid at her twenty-second title to her first major win.
On the men’s side, after three finals appearances, Novak Djokovic defeated Andy Murrary to win his first French Open title. With this win, the World No. 1 joined the members of the career Grand Slam club and cemented his place in the conversation for greatest of all time.
Though the paths and contexts of the wins for each champion were quite different—the one an undeniable Goliath of the sport looking to be an all-surface champion and the other facing a Goliath looking to make history—both had to find a way to outclass a fierce opponent. For each, dominating on serve was critical. Djokovic won 63% of points, whereas Murray managed to win just over 50% of points on his serve (51% to be exact). Muguruza also won an impressive 62% of points on serve, edging out the 57% of points won by Williams.
Although these stats tell us that the champions at Roland Garros were more effective on serve than their opponents, can we also conclude that they were more efficient? What exactly does it mean to be an “efficient” server anyway?
This is exactly what Klaassen and Magnus try to work out in myth 14 of Analyzing Wimbledon.
Myth 14: “Players have an efficient service strategy”
Before getting to the idea of efficiency, we have to first talk about the risk-reward trade-off of serving. This trade-off is the push-and-pull between how likely a serve is to go in and how difficult it will be for the receiver to return. We probably all have seen instances where a server makes a double fault because he or she was going for “too big” of a second serve. If you have ever thought that, you have seen the risk-reward trade-off at work.
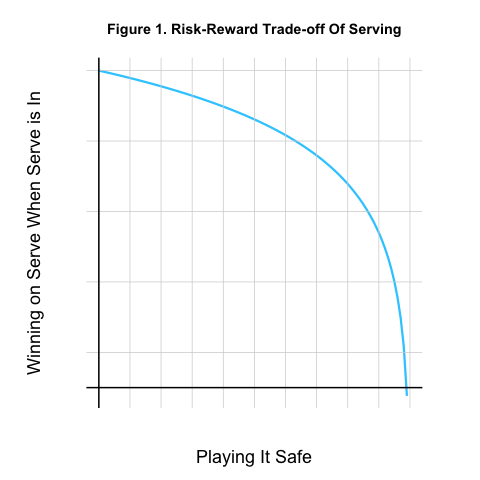
Like a pitcher in baseball or a shooter in basketball, a top tennis player has to find the right balance between the difficulty and risk of a shot in order to have the highest overall chance of successful outcome. To find the sweet spot, K&M introduce the “y-curve”. This curve describes the mathematical relationship between the chance a point on serve is won by the server when the serve is good against the risk that the serve is out. In other words, it is a plot of the risk-reward trade-off.
A hypothetical example is shown in Figure 1 below. Here, it is assumed that the most effective serves also carry the most risk of a fault.
The great thing about the “y-curve” is that, if you knew what it was, you could find the optimal strategy for a server. The optimal strategy for the server is always to do what will increase the overall chance of winning a point. To see how the “y-curve” above can help with finding an optimal service strategy, it is easiest to consider the case when a player gets only one serve, that is, if the second serve were eliminated from the game.
In one-serve tennis, the chance of winning the point can be broken down into this conditional relationship:
$$ P(Win) = P(In) \times P(Win | In) $$
This says that the chance of winning a point on serve is equal to the chance of first getting a serve in then winning the point on a good serve. These two components are exactly what describe the “y-curve”.
This means we can reduce this to a one-parameter problem (getting the serve in) by substituting the probability of winning when a serve is good with the “y-curve”. If we can do that, then we just need to do a little differentiation to find the risk-level that maximizes the chance of winning the point.
This would also allow us to define an “efficient” server as the server who plays an optimal strategy. Mathematically, if we use “*” to represent the best possible (optimal) percentage of points won on serve, this would be:
$$ Efficiency = P(Win) / P(Win)^* $$
All servers would want to get this number as close to 1 as possible to be getting the most out of their serve.
Estimating Serve Efficiency
Two things complicate the study of optimal serves. First, there are two serves in tennis. Second, we don’t know what the “y-curve” is. The first one isn’t actually a huge complication. It is fairly easy to extend the above to the case with two serves.
The second issue is more difficult to get around. If we really wanted to know a server’s “y-curve” (and I am assuming each server’s risk-reward curve could look a bit different), you would want to set up an experiment where you have a server serve to a competitor many, many times, each time knowing what they were intending to do (“I am going fast down the T”, or “I am going to do a kicker wide”, etc.). You would collect many observations of attempts of the same serves, record how often they went in, and how often they were won against the competitor. These would give you the data to construct the “y-curve”.
Without such an experiment, K&M consider a number of hypothetical curves using a power law function. They then consider the percentage of points won and percentage of serves in on first as one point along the curve and the same numbers on second serve as another point. From this they can identify all but the shape parameter of the curve. Seems a critical missing piece, but they say for defining player efficiency it actually isn’t too important because the maximal serve win probability doesn’t change much even with big changes in the shape parameter.
I am not so sure, but let’s say we can trust K&M’s approach. What do they find?
Using the observed averages (serves in and service points won) on first and second serve, they conclude that the service efficiency of the ATP tour is is 98.9% for the men and 98.0% for the women. From this, they conclude:
“This is pretty efficient, but not fully efficient, and we reject the hypothesis.”
Revisiting Serve Efficiency
If we apply the same methodology to the present game, we would define the following y-curve for the men,
$$ Prob(Win; |; x) = \gamma_0 - \gamma_1 \times x^3 $$
and a similar curve for the women,
$$ Prob(Win; |; x) = \gamma_0 - \gamma_1 \times x^{3.8}. $$
In each case, the value x is the proportion of serves that go in, which is the complement of the risk of the serve. With the above functions in place, we can optimize the chance of winning a point on serve for each player, given their first and second serve characteristics. Using all matches from 2012 and 2014, we can compare what this way of thinking about optimal service suggests about the service efficiency of top players.
The interactive graphic below (Figure 2, hover to see player names) shows that the average efficiency for the ATP is 98%. This is very consistent with what K&M found and leads to the same conclusion that most players are under their optimal serve performance by 1 or 2 percentage points.

For the WTA (Figure 3), the average efficiency based on performance during 2012 and 2014 was 97%, which is slightly further away from optimality than the ATP. Interestingly, one outlier was Victoria Azarenka, who, according to the K&M analysis, is much further from her optimal percentage of service points won than other players. Azarenka had an estimate optimal serve win percentage of 69.5% (even higher than Serena Williams!), while her observed serve win percentage was only 54% for this period. Of course, this could also indicate that the average y-curve isn’t a good fit for Azarenka.

Summary
Myth 14 introduces us to some ways we can think about and try to model optimal serve strategies in tennis. Although K&M present some interesting results that suggest that players are generally not serving optimally—which are consistent with other studies that suggest that players are too conservative on second serves, for example—there still remains a bit of magic in how they setup their risk-reward curve. If a way could be found to estimate the risk-reward curve more directly for individual players, it would be a huge breakthrough for serve strategizing.